

The iShares High Yield Bond ETF (HYG) chart suggests a neutral trend that should allow investors to profit from the level of interest income with limited downside risk over the next several months, asserts Marvin Appel, MD, PhD, of Signalert Asset Management.
Get Trading Insights, MoneyShow’s free trading newsletter »
Corporate high yield bond funds have stalled since hitting their last highs in early August. Is this a prelude to a significant correction or should you ride out the doldrums?
The chart of the iShares High Yield Bond ETF (HYG) suggests a neutral trend that should allow investors to profit from the level of interest income with limited downside risk over the next several months. Recently, retracements to the 87.25 level have been met with a surge in volume and a recovery in the price of the ETF.
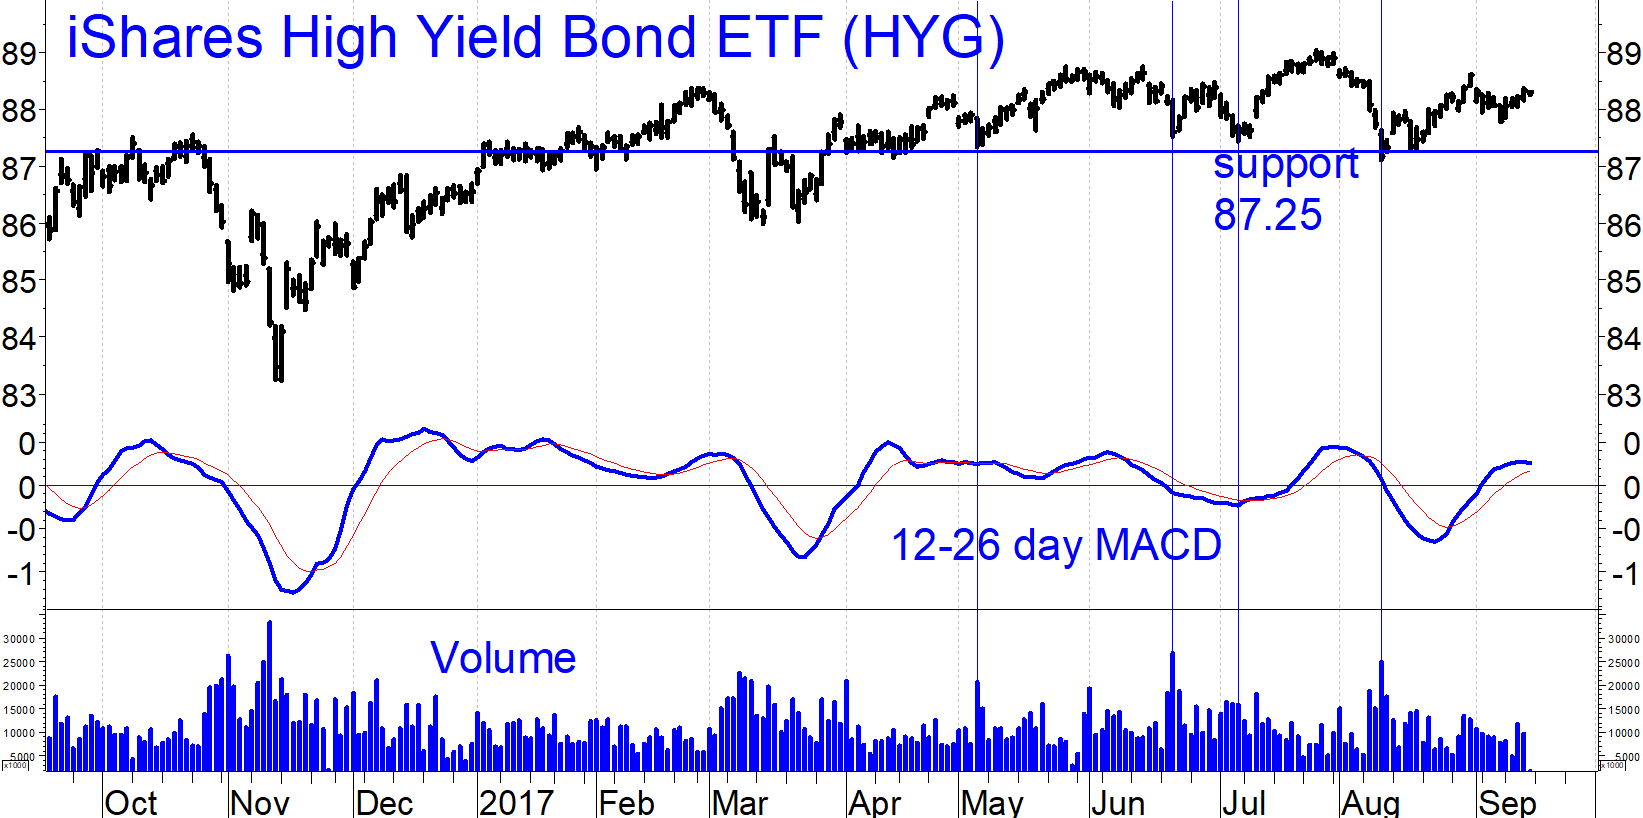
(See vertical lines in the chart above.) Conversely, it appears that HYG will have trouble making new highs.
Advertisement
Both price and MACD have formed falling double bottoms. Overall, the chart pattern is neutral. With a yield of 4.9%, it will take three months’ of interest to cover just the risk of a retest of 87.25.
The newsletter portfolios will continue to hold their high yield bond funds since our models are on buy signals.
Trade idea: On the other hand, we have taken some profits for clients. Certainly, do not chase high yield bond rallies. You can consider adding to positions at the time of a retest of 87.25.
Subscribe to investment newsletter Systems and Forecasts here…


