

The daily S&P500 Emini futures candlestick chart has been in a broad bull channel since March. Every breakout has pulled back below the breakout point. That is likely to happen over the next several weeks, even if the rally continues higher, asserts Al Brooks.
Get Trading Insights, MoneyShow’s free trading newsletter »
Monthly S&P500 Emini futures candlestick chart:
Parabolic wedge buy climax
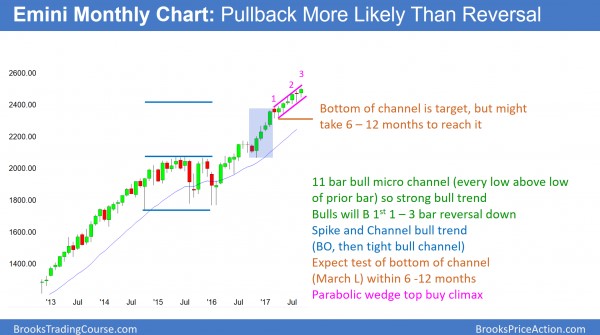
The monthly S&P500 Emini futures candlestick chart has a bull body so far this month, and the trend is strong. Since every bar for the past 10 months has a low above the low of the prior bar, the rally is a bull micro channel. However, it is also a nested parabolic wedge bull channel and therefore a buy climax.
Every bar on the S&P500 Emini monthly futures candlestick chart for the past 10 months had a low above the low of the prior month. This is an 11 bar bull micro channel, which is a sign of strong bulls. The bulls have been so eager to buy that they have been buying above the low of the prior month. Therefore, they will aggressively buy below the low of the prior month. Consequently, if next month falls below this month’s low, the bulls will buy the reversal down. As a result, the reversal down will probably only last 1 – 3 months and become a bull flag. Hence, the downside risk over the next several months is small.
Since the 11-month rally has had a series of big bull bars followed by pauses, it is a parabolic wedge bull channel. A parabolic wedge is a buy climax, and it usually leads to a pullback. Therefore, a pullback is likely within the next 3 months.
Strong bull trends increase risk and lead to profit taking
Advertisement
While a micro channel is a sign of strong bulls, it is also unsustainable. It, therefore, is a buy climax. The stop for the bulls is below the bottom of the micro channel. Hence, it is below the November low of 2066.75, which is about 20% down.
Since that is far, the risk is big and growing. Institutions always control risk. When risk becomes unacceptable, they take steps to reduce it. The easiest choice is to take some profits. As a result, an increasing number of firms will begin to sell out of some of their longs. Once enough do it, the month will fall below the low of the prior month.
While any reversal can lead to an opposite trend, the 1st reversal down in a bull micro channel has a 70% chance of being minor. This means it will likely become a bull flag. Since the trend is very strong, the bull flag will probably be brief. The bulls will probably aggressively buy the small selloff. The bull trend will likely resume up within a few bars (months).
Weekly S&P500 Emini futures candlestick chart:
Extreme buy climax
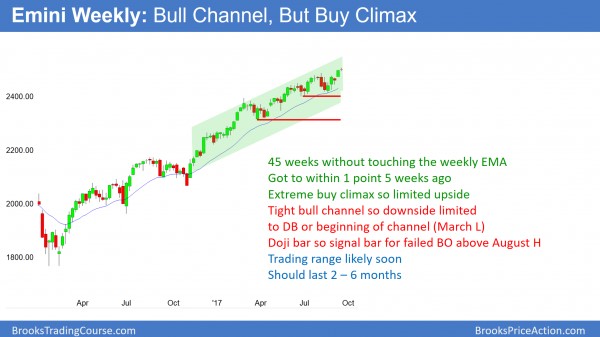
The weekly S&P500 Emini futures candlestick chart has not touched its 20-week exponential moving average in 45 weeks. Furthermore, this week is a doji bar. It, therefore, represents bad follow-through buying after last week’s breakout above the 2500 Big Round Number and the August high. Consequently, it is a sell signal bar for next week for a failed breakout.
The weekly S&P500 Emini futures candlestick chart formed a bear doji bar last week. This is bad follow-through buying after the previous week’s breakout above the August high and the 2500 Big Round Number. It is a sell signal bar for this week.
In addition, the weekly Emini chart has not touched its 20 week EMA in 45 weeks. Since that is extremely rare, it is unsustainable and climactic. Consequently, the odds are that it will fall at least a little below the average price soon. While theoretically it never has to come down to the average price, that has never happened. In fact, it has only been above the average price this long once before in its 18-year history.
When it last happened in 2003, the Emini corrected 10% and stayed in a tight range for the next 10 months. Although a pullback now will probably not last 10 months, it is likely to last at least 10 weeks and have at least 2 legs. Furthermore, it will probably fall at least 5%. This is because this is what typically happens in a buy climax.
Daily S&P500 Emini futures candlestick chart:
Emini breakout above August high and 2500 big round number
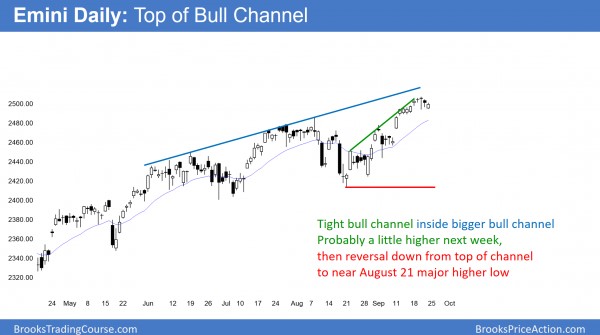
The daily S&P500 Emini futures candlestick chart broke to a new high and above the 2500 Big Round Number. However, it is in its 5th leg up in a broad bull channel, and the breakout is stalling.
The daily S&P500 Emini futures candlestick chart has been in a broad bull channel since March. Every breakout has pulled back below the breakout point. That is likely to happen here over the next several weeks, even if the rally continues a little higher 1st. In addition, the selloff from the August 8 high was deep. It retraced most of the rally from the June 29 major higher low.
Trends tend to become weaker over time, and eventually evolve into trading ranges. As a result, the upcoming selloff has an increased chance of being deep as well.
Furthermore, since channels usually evolve into trading ranges after 3 – 5 legs up, the Emini will probably soon enter a trading range. This means that the next selloff has an increased chance of falling below the last major higher low. That is the August 21 low, which is almost 100 points below the high.
If the selloff is strong, it will probably lead to a 2nd leg down after any bounce from support of the August 21 low. If it sells off from a lower high, traders will begin to talk about a head and shoulders top (lower high major trend reversal). This entire process will probably require 20 – 50 bars. This is 1 – 3 months, and it is consistent with the likely depth and duration of the pullback on the weekly and monthly charts.
Could the correction be 20% instead of 5%?
One final note is that Nobel Prize economist Robert Shiller, whom I respect, wrote on Sept. 21 that he thinks there is an increased risk of a 20% correction. However, he said timing it is the problem, and that the current rally could last much longer before the 20% correction comes. He pointed out similarities between the current rally and the prior 13 corrections of 20% or more.


