

Even if the bears get a 100 point reversal, the odds are that the bulls will buy it because this 8-day rally has been exceptionally strong. The odds favor higher prices over the next week or two, asserts Al Brooks.
Get Trading Insights, MoneyShow’s free trading newsletter »
Monthly S&P500 Emini futures candlestick chart:
Extremely strong breakout, but climactic
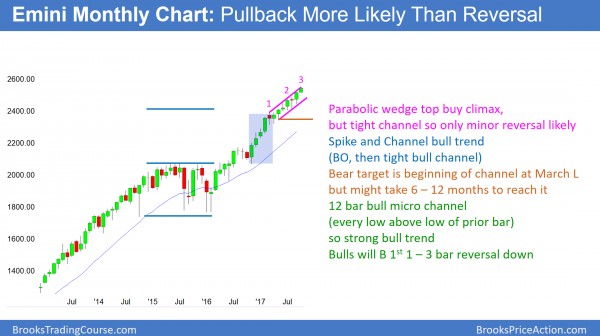
The monthly S&P500 Emini futures candlestick chart so far has a bull trend bar this month. Yet, this is the 12th consecutive month without a pullback, and therefore the rally is a buy climax.
The monthly S&P500 Emini futures candlestick chart has 12 consecutive bars where the low of every bar is above the low of the prior bar. This has only happened once in S&P futures or Emini contracts the past 50 years. That was in the strong bull breakout of 1995 when the Republicans took over Congress.
Advertisement
That micro channel had its 1st pullback after the 13th month, and the bull trend continued up for 4 years. The breakout led to the biggest rally in at least 50 years, with the market quadrupling over those next 4 years.
Because the current rally is coming 8 years into a bull trend, it is unlikely to lead to a move that is anywhere near as strong as the one after the 1995 breakout. However, because it is so strong, the best the bears will probably get over the next few months is a 100 – 200 point pullback. The bulls will buy it so it would be a bull flag.
After testing the high, the bears might get a micro double top. But, even if they do, probably the best they will get over the next 6 months is a trading range with a 5 – 10% pullback. Consequently, the downside risk over the next 6 months is small. The bulls will buy reversals down and they will become bull flags.
Weekly S&P500 Emini futures candlestick chart:
Strong breakout above a wedge top
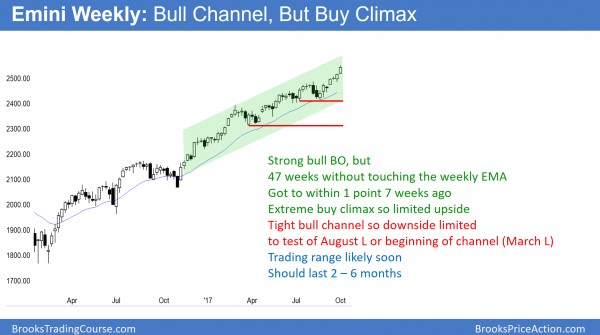
The weekly S&P500 Emini futures candlestick chart tried to turn down from a wedge top in August. Instead, the bulls bought the selloff and the Emini is now breaking strongly above. The odds are that the bulls will buy the 1st reversal down from the current breakout.
The weekly S&P500 Emini futures candlestick chart is in a strong breakout above a wedge top. Bulls will buy the 1st reversal down. Consequently, the odds favor at least one more leg up.
While the August pullback got to within a point of the 20-week exponential moving average, it did not touch it. This means that it has remained completely above for the past 47 weeks. The only other time in the 19-year history of the Emini that was longer was in 2003. Then, the rally stayed above for 50 weeks. When it finally pulled back to the average price, the pullback was about 10%. In addition, the Emini went sideways for the next 10 months.
Since the current rally is just as extreme, the odds again will favor a longer and possibly deeper pullback than what traders might expect. At a minimum, the pullback will probably fall at least 100 points, but it might be 5 – 10%.
Only small chance of a reversal for at least a couple weeks
Since the current rally is so strong, the risk of the pullback beginning within the next couple of weeks is small. The bears will need at least a micro double top. That would require a 1 – 3 bar pullback, and then a 1 – 3 bar rally back up to high.
Even if the bears then get a bigger pullback, the weekly chart is in a tight bull channel. Therefore, the best the bears will probably get over the next few months is a trading range. The bulls will buy any pullback, even if it is surprising deep.
Daily S&P500 Emini futures candlestick chart:
Strong Emini breakout above bull channel after proposed tax reform
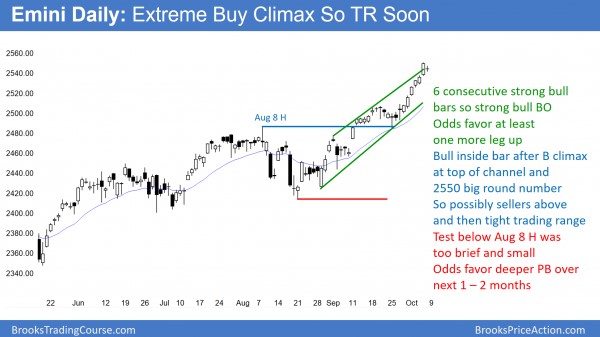
The daily S&P500 Emini futures candlestick chart is breaking strongly above a bull channel that began in March. The odds favor at least a small 2nd leg up. It stalled on Thursday at the 2550 Big Round Number and the top of the tight bull channel.
The daily S&P500 Emini futures candlestick chart had 5 pushes up in a bull channel since the March low. There was a 75% chance of a bear break below the bull trend line and then an evolution into a trading. Hence, there was only a 25% chance of a strong bull breakout. The current 8-day rally is a rare successful breakout. The rally has been so strong that the odds favor at least a small 2nd leg up. Consequently, the bulls will buy the 1st pullback. As a result of how eager the bulls are, the 1st pullback will probably only last 1 – 3 days. Furthermore, the best the bears will probably get over the next 2 weeks is a trading range.
A broad bull channel functions as a wedge top. A measured move up from the breakout above this top is around 2650. Will the bulls get there without more than a 50 point pullback? Probably not. However, even if the bears get a 100 point reversal, the odds are that the bulls will buy it because this 8-day rally has been exceptionally strong. The odds favor higher prices over the next week or two.


