

Amid improving economic reports, what are the chances of a tax plan actually passing this year, writes Don Kaufman, co-founder of TheoTrade.
One of the reasons the American economy is having a good year is the global economy is dragging it along.
Emerging markets have accelerated growth this year as even Brazil is doing well despite its political woes. Technically, it’s tough to say which country is driving the growth when you have trade up. As the saying goes “it takes two to tango.”
Get Trading Insights, MoneyShow’s free trading newsletter »
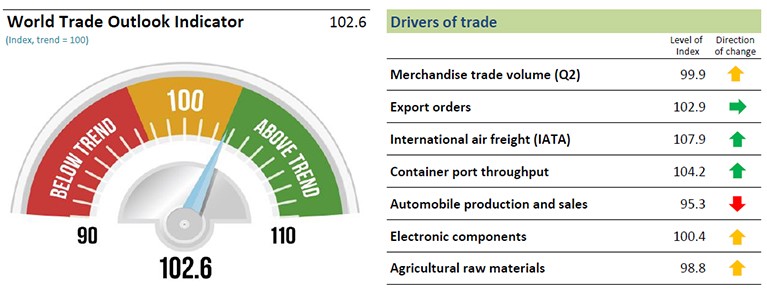
Whichever country is leading, trade is above average as you can see from the chart below. Volume of merchandise trade, international air freight, container port throughput, electronic components, and agricultural raw materials are all heading higher. Automobile production and sales went up recently because of the hurricane replacement cycle, so the next time this is updated, trade will look better.
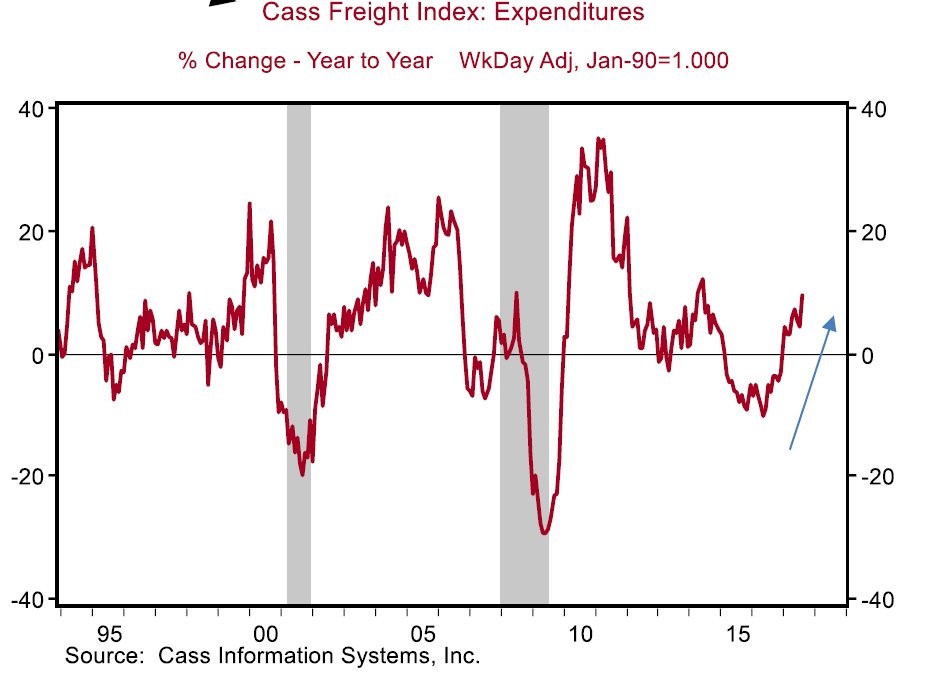
Trade through international air freight and container shipping aren’t the only areas that are strong. As you can see in the chart below the trains are doing well too as the Cass Freight Index for expenditures is rising quickly. This chart makes it look like there was a mini-recession in 2015-2016. It was the weakest non-recessionary period since at least 1994. This is an important point to make because it means there might be another few years left in this cycle as a new growth period is emerging.
The size of the weak period in 2015-2016 was in between a recession and a mid-cycle slowdown. Either way, the economy is now firing on all cylinders as train shipping is up. According to Dow Theory, whenever the transports are up, it’s a great sign for the overall market.
CSX (CSX) stock had an over 40% drop from May 2015 to January 2016. Since then, the stock is up 141% as it’s very close to the all-time high set in the summer of 2017.
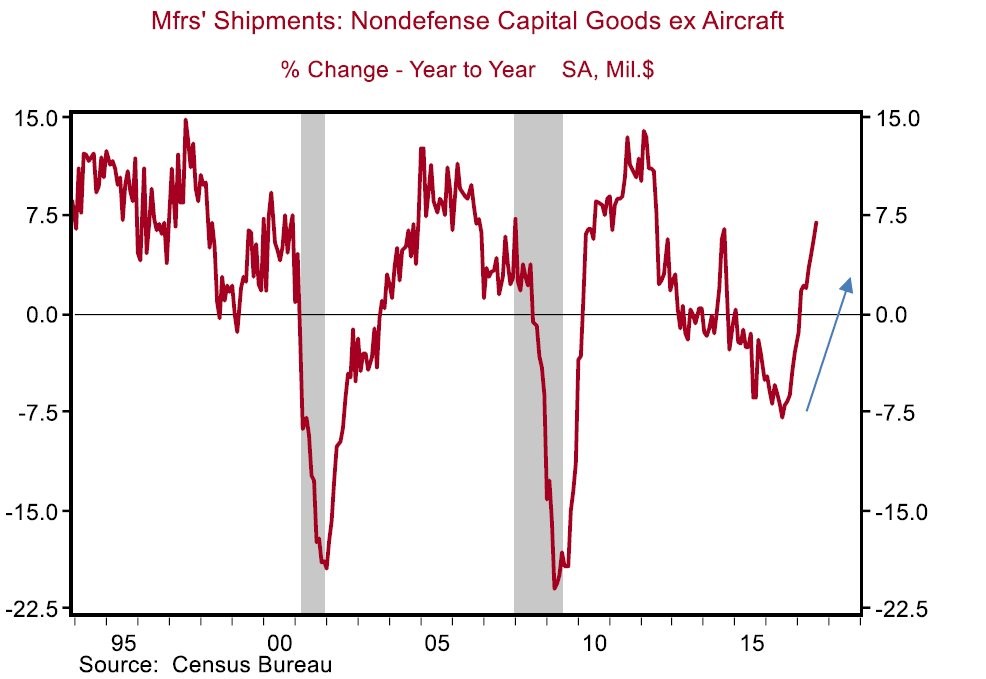
Not only is the shipping industry doing well, the manufacturers non-defense capital goods shipments are also improving. Some bears worry about the ISM reports being survey data, but they aren’t the only ones exuding positivity.
As you can see, the manufacturing sector is in one of its strongest periods of this cycle.
Economic reports of the week
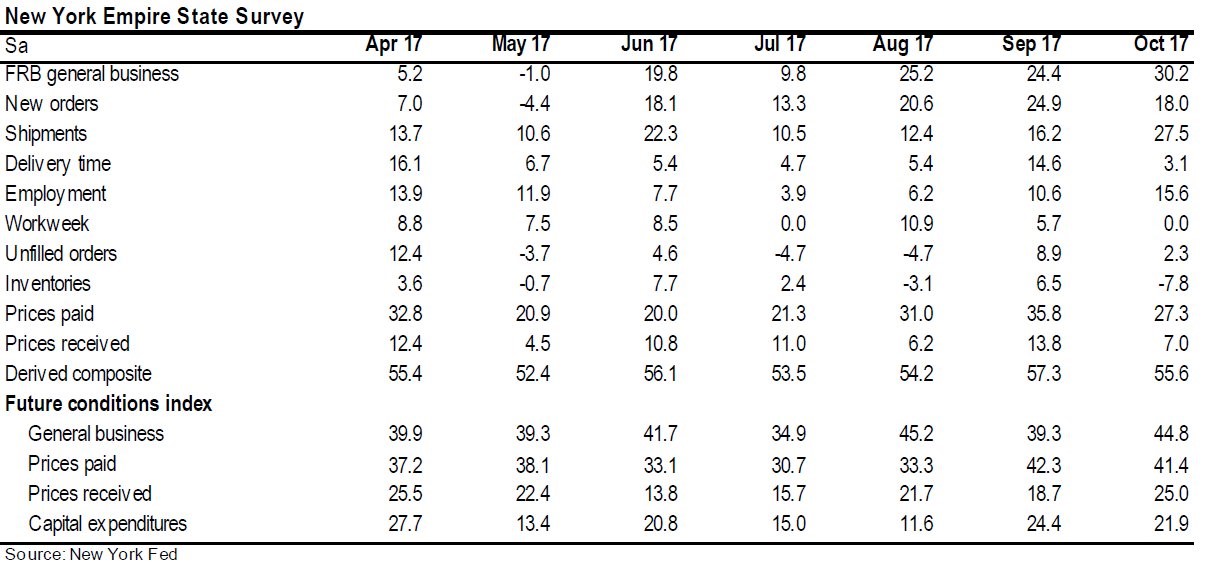
I haven’t reviewed any of the economic reports this week, so let’s look at the major ones. The Empire Manufacturing Survey was released on Monday. As you can see from the table below, the headline number which is general business conditions increased from 24.4 to 30.2. That’s the highest level in 3 years. It perfectly corroborates with the manufacturing shipments in the chart above.
The labor indicators show a strong improvement in employment. I’m expecting the October jobs report to be a big rebound from last month. This report shows that the manufacturing sector will pull its weight. Not only is the current situation looking great, but future estimates look better as well. The index for future business conditions increase 6 points to 44.8. It makes sense the prices paid and prices received indexes fell from September because they were inflated because of the hurricane. This signals to me inflation will fall in October after the CPI beat for the first time in 5 months in September. The inventories index was the other one which reversed after having sharp storm effects.
On Wednesday the Atlanta Fed business inflation expectations index was released. It’s tough to get a reading on what this means because the survey has only been in existence for 4 years and the results hardly vary. In the October unit cost reading, inflation fell from 1.9% to 1.8%. Even though this is a Fed report, I think the Fed will probably stay focused on the core inflation reports: CPI and PCE.
It will be interesting to see if the Fed looks at any different indicators when the new chairperson takes the helm in February 2018. I’m not expecting any major changes if it’s Powell. He is now at 46% as the betting odds continue to fluctuate right before the announcement is made probably sometime next week.
Tax cut update
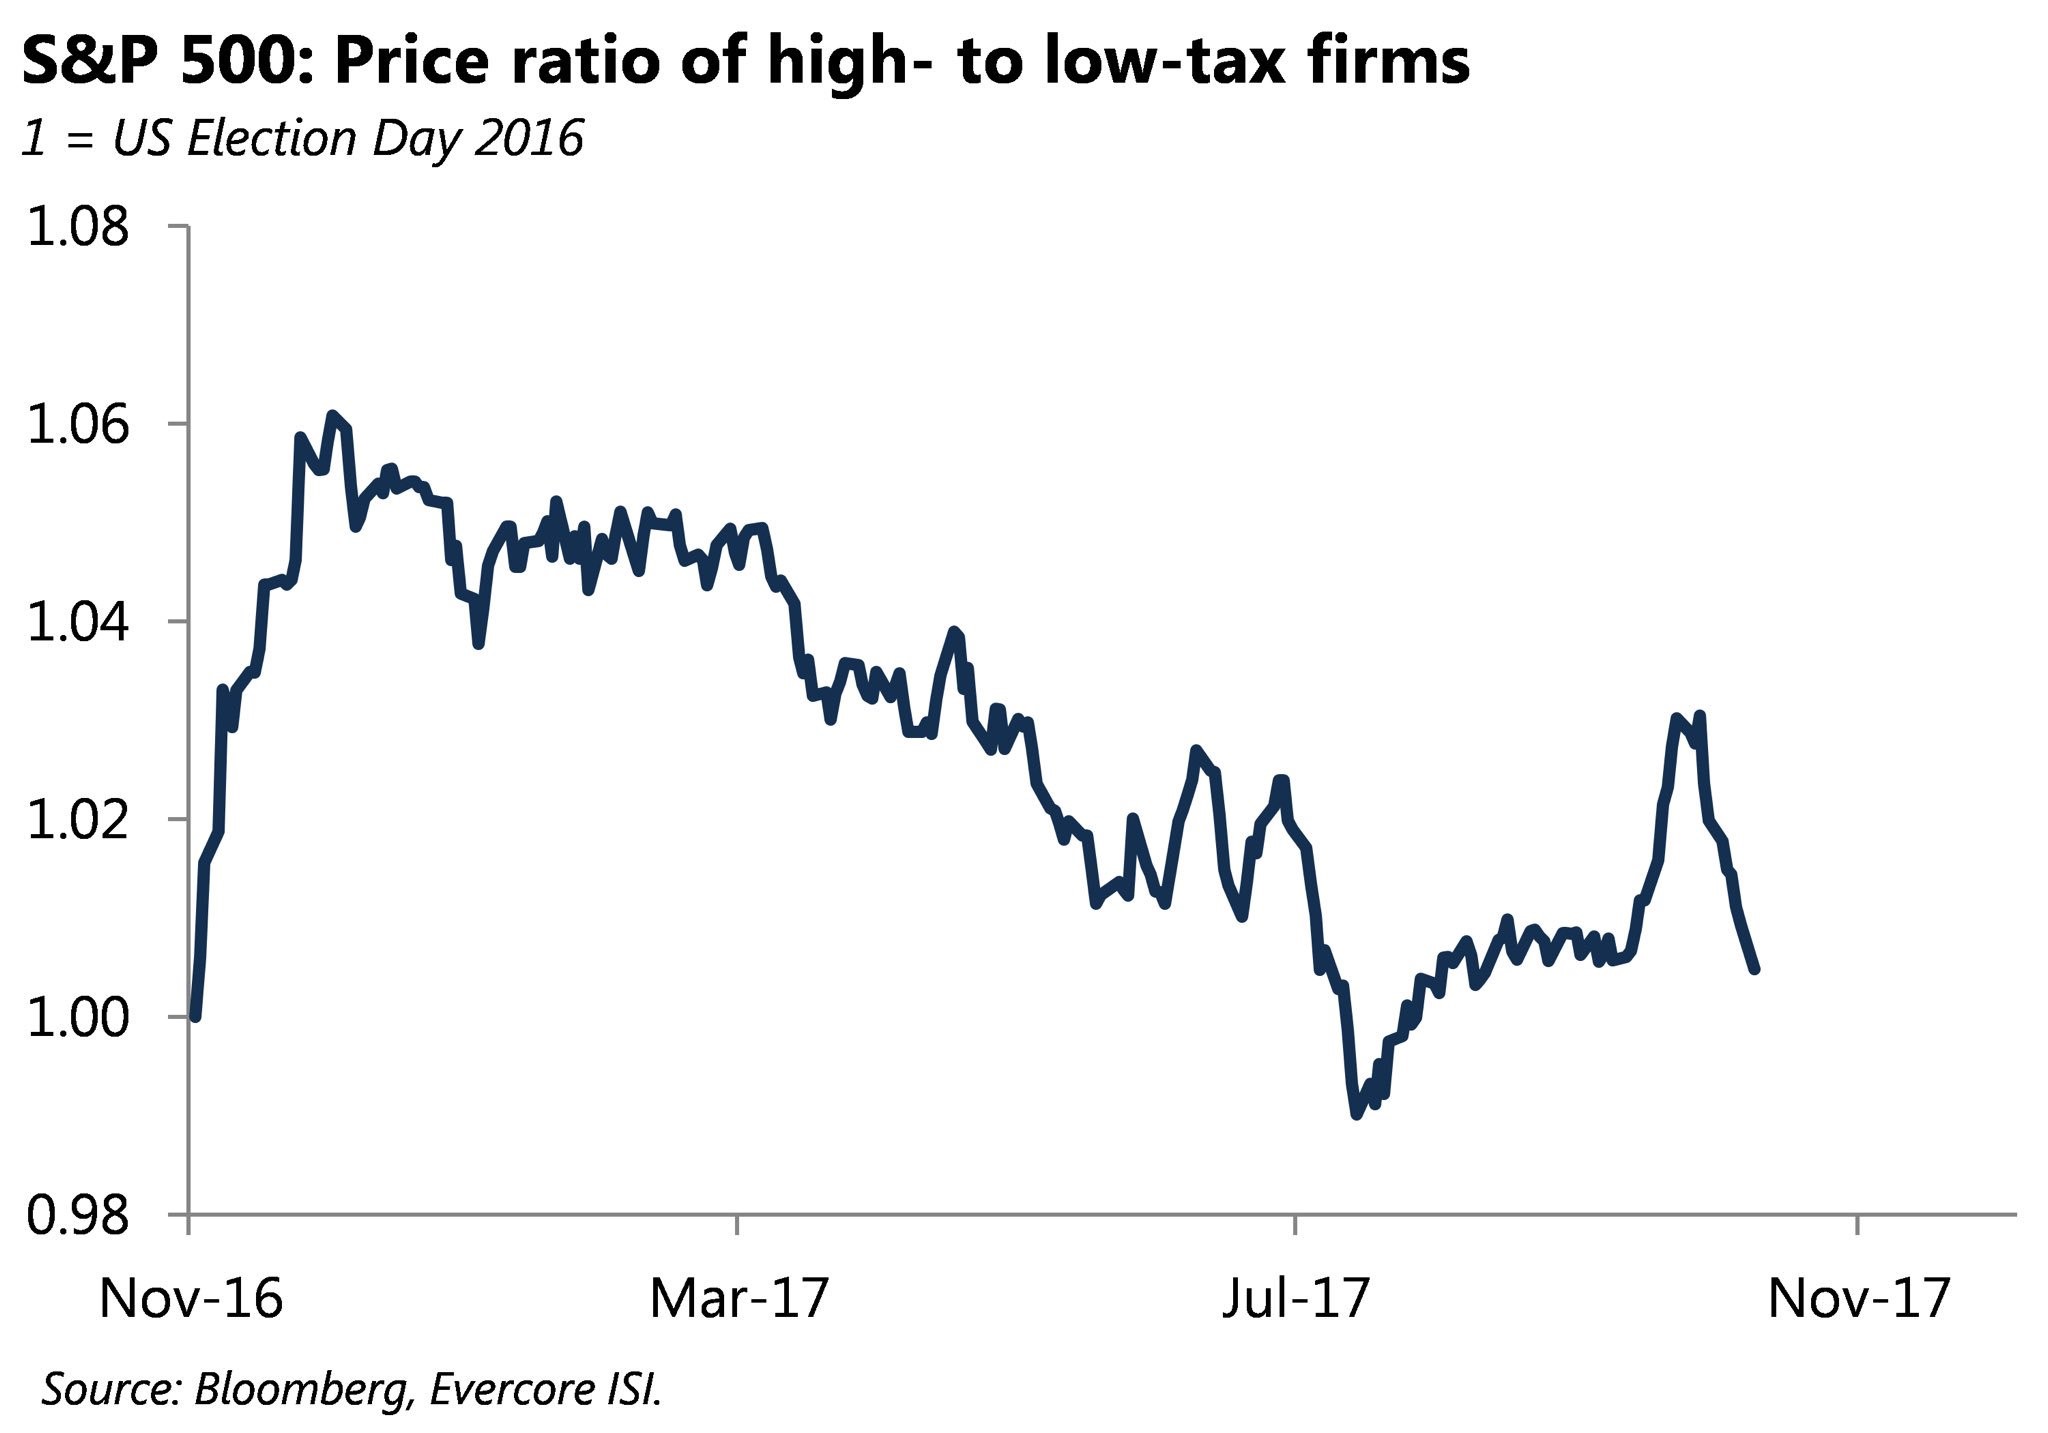
As you can see from the chart below, the S&P 500 (SPX) ratio of high to low tax firms is falling, indicating the chances of a tax cut are falling. The ratio is nearing the lowest point since July and it’s close to the flatline, indicating stocks aren’t expecting anything to happen.
Even though Rand Paul loudly expressed his disappointment with the GOP exceeding spending caps by $43 billion, the Senate was able to pass a budget resolution with a vote of 51-49. This clears the way for tax reform.
The 2018 budget passing is the second step towards passing tax reform under a continuing resolution which needs a majority in the Senate and the House. The budget includes proposed spending cuts and entitlement reforms, but the main point is to use it as a way to get tax cuts done. The House and Senate compromised on issues which means the bill won’t need to go to a committee which saves a week. To me, time isn’t a major factor because the deadline of passing a tax cut by the end of the year is self-imposed by the White House.
Many prior deadlines have been blown through as the GOP Congress struggles to unite. The issue that Rand Paul had was with increasing the Pentagon’s 2018 budget to $640 billion without spending cuts to offset it. This was able to get defense hawks on board with the plan; they outnumber the libertarian-leaning members.
While this is good news for the odds of the bill passing, we’re still not close to it happening. PredictIt has the odds of an individual tax cut being passed by the end of the year at 27% and the odds of a corporate tax cut at 23%.
Neither the House nor the Senate has come up with a bill to vote on. Paul Ryan is targeting early November to get a vote done, but it will probably take longer. It’s important to note that by the House agreeing this plan won’t go to a committee, it means the chances that a plan which adds as much as $1.5 trillion to the debt over 10 years will be passed.


