

The bulls are buying every reversal down. This leads to a series of new highs in a growing buy climax. Traders need to see the absence of this buying to conclude that the market is behaving differently and a pullback is beginning, asserts Al Brooks.
Monthly S&P500 Emini futures candlestick chart:
Emini buy climax continuing with Trump’s tax cuts
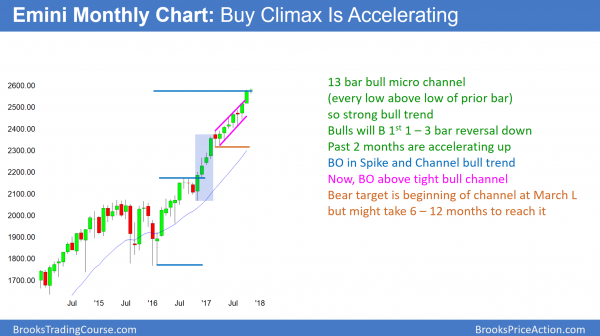
Every low for the past 12 months on the monthly S&P500 Emini futures candlestick chart has been above the low of the prior bar. This is a 13-bar bull micro channel. It is a sign of a strong bull trend and a buy climax.
The monthly S&P500 Emini futures candlestick chart is in a 13-bar bull micro channel. This has happened only once in the S&P500 cash index in the past 50 years, and therefore represents extreme buying. Since it is a sign of aggressive bulls, the odds of a significant reversal over the next 6 months are small. The bears usually need at least a micro double top before they can get a 20% correction.
However, markets rarely stay far beyond their typical behavior for long. Consequently, the odds are that there will be a pullback within the next couple of months. A pullback simply means that the low of a bar falls below the low of the prior bar. Because the bull trend is so strong, the odds are that the pullback will be brief. It will therefore probably last 1 – 3 months and be a bull flag.
Yet, because the climax is extreme, the rally back up has a 50% chance of stalling at the high. This could result in another small leg down, which would begin a tight trading range. Less likely, that reversal down from the micro double top could lead to a 10 – 20% correction. This would still be a minor reversal on the monthly chart.
Endless pullback or collapse unlikely
About 20% of the time, a pullback just keeps growing to 20 or more bars. That is an endless pullback. If that were to develop, the bears would have a 40% chance of a bear break below that extended bull flag and then a measured move down. Since this is a monthly chart, the bears would need more than a year to create a pullback that qualifies as endless.
Can the Emini simply selloff 20% without a micro double top or an endless pullback? Anything can happen, but that is unlikely. The bulls would buy the 1st reversal down, even if it was 500 points. The bears might then get a bear trend if the rally up reversed back down strongly. This would be a lower high major trend reversal.
Weekly S&P500 Emini futures candlestick chart:
Extreme buy climax, but no strong top yet
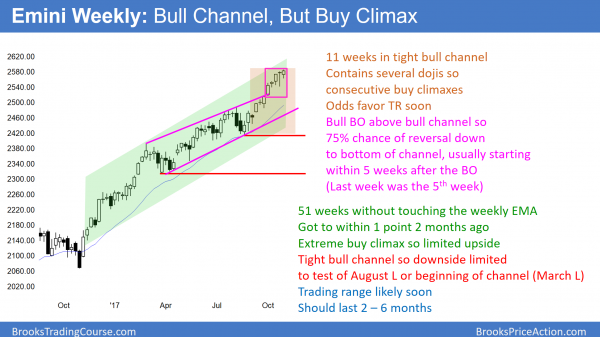
The weekly S&P500 Emini futures candlestick chart has been above its 20-week moving average for 51 weeks. Last week was a small bull bar and the prior week was a doji bar. These therefore represent a loss of momentum. This is the 5th week in a bull breakout above the top of a bull channel.
The weekly S&P500 Emini futures candlestick chart has been above its 21-week exponential moving average for 51 weeks. While this represents aggressive buying, it has never happened in the 18-year history of the Emini. It is unsustainable and therefore climactic.
Although it means that a pullback to the average is likely to begin in the next couple of months, the bull channel of the past 9 months is very tight. Even if next week trades below this week’s low, this week had a bull body. It is therefore a weak sell signal.
Bull breakout above bull channel
When there is a breakout above a channel that has legs that last at least 5 – 10 bars, there is a 75% chance that the breakout will fail and begin to reverse within 5 bars. The pullbacks in the tight bull channel that began in July have only lasted 2 – 3 bars. Therefore, the 75% rule does not apply.
However, the 11-week rally has had bad follow-through bars after big bull bars. This usually happens when a rally will soon transition into a trading range. That series of bull bars is a series of consecutive buy climaxes, and it usually leads to exhaustion. An exhausted bull trend usually evolves into a trading range for at least 10 bars. Ten bars is about 2 – 3 months. About 25% of the time, it quickly reverses into a bear trend.
Daily S&P500 Emini futures candlestick chart:
Wedge bull channel in strong bull trend
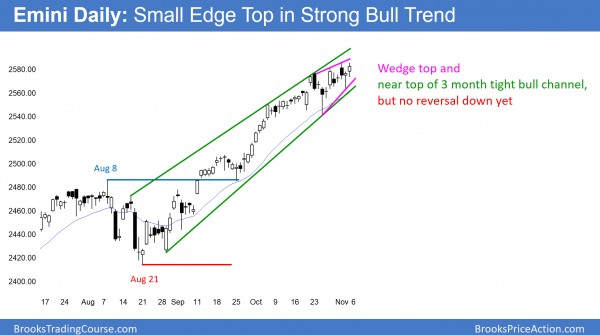
The daily S&P500 Emini futures candlestick chart is forming a small wedge top in a strong bull trend
Last week, I posted a chart that showed that the daily S&P500 Emini futures candlestick chart has not had a 3% correction in 242 days. This is the longest stretch since before the Great Depression that began in 1929. Yet, there is no top yet, and the streak continues to grow.
Theoretically, the Emini never has to have even a 1-point correction, but that is not what happens in the real world. It obviously has 1-point corrections every couple of minutes every day. When will there be a 3 – 5% correction? Markets are based on rational human behavior, and that means patterns form and the behavior repeats itself regularly. Consequently, the Emini will again likely have a 5% correction beginning within the next few months.
In fact, it will probably have a 50% correction at some point in the next 20 years because that is what is has always done. There are always going to be unanticipated huge disruptions that result in a deep repricing of the stock market. Similarly, the Emini will eventually reach 100,000, but not in my lifetime.
Wedge top, but most tops fail
The Emini has been forming a wedge top over the past few weeks. Yet, look back at any bull trend. You will see countless tops and 80% of them fail. What are the chances that the current one will finally be the one that works? Since the buy climax is extreme, a correction is increasingly likely. However, the odds still are that every top will fail and lead to at least another small leg up.
The bears need a strong reversal down and good follow-through selling before traders will conclude that a 5% correction is underway. That usually means consecutive big bear bars on the daily chart. Look back over the past 6 months. There have been many big bear bars, but no consecutive big bear bars. The bulls are buying every reversal down. This leads to a series of new highs in a growing buy climax. Traders need to see the absence of this buying to conclude that the market is behaving differently and a pullback is beginning.


