

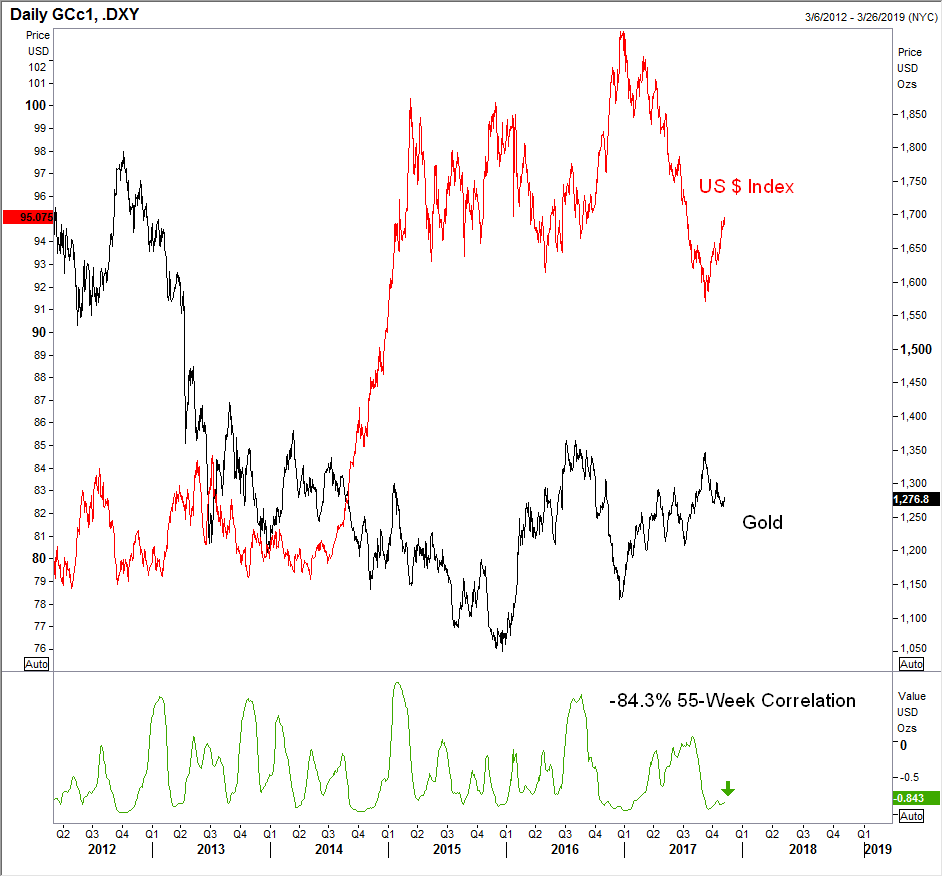
The 55-week gold to US dollar index correlation is a whopping -84.3%; i.e. as gold goes up, the dollar goes down, and vice versa, writes Jack Crooks of Black Swan Capital on Thursday.
Quotable
“Nothing whets the intelligence more than a passionate suspicion, nothing develops all the faculties of an immature mind more than a trail running away into the dark.”
― Stefan Zweig, The Burning Secret and other stories
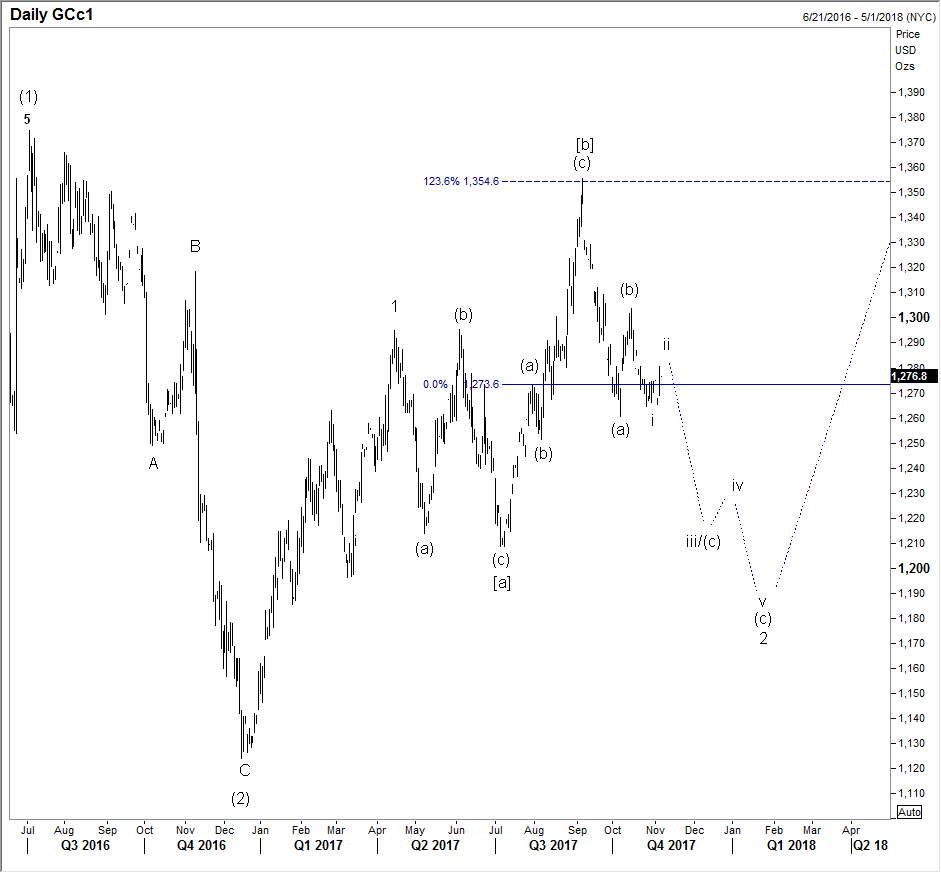
Our rendition of an Elliott Wave chart shown says it’s time to sell gold; i.e. once minor corrective rally Wave ii completes—that may be today).
Targets lower are 1,210; then 1180-level. And if the U.S. dollar catches a major bid, there is scope to test the swing low of 1,123 from mid-December 2016 (gold vs. dollar weekly chart).
Note: The 55-week gold to US dollar index correlation is a whopping -84.3%; i.e. as gold goes up, the dollar goes down, and vice versa.
Gold Futures Daily Wave Chart
Gold Futures vs. US Dollar Index Weekly Chart
We should find out soon whether Mr. Elliott is correct.
View Currency Currents, commentary, and analysis at Black Swan Capital here…


