

Everyone knows how extreme the market is. Once it begins to correct, the bulls will get out quickly. That increases the odds that the 5% correction could be very fast, asserts Al Brooks.
Monthly S&P500 Emini futures candlestick chart:
Strong bull trend, but buy climax
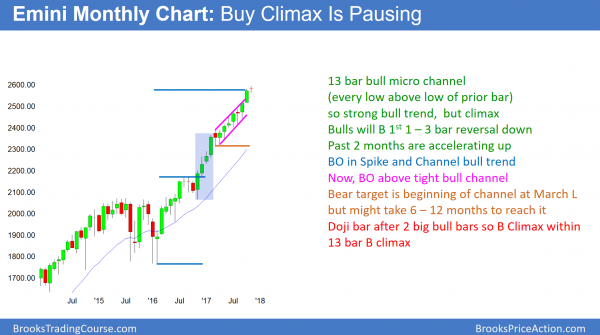
Every bar for the past 12 months has a low above the low of the prior month on the monthly S&P500 Emini futures candlestick chart. This is a 13-bar bull micro channel and therefore a strong bull trend. Since it is extreme, it is unsustainable and therefore climactic.
The monthly S&P500 Emini futures candlestick chart is in a 13-bar bull micro channel. This has happened only once in the S&P500 cash index in the past 70 years, and never in the 18-year history of the Emini. It is therefore extreme behavior.
While it can get much more extreme, it will more likely return to more typical behavior. That means that a 1 – 3 month pullback will probably begin before year end.
Since the micro channel is a sign of very eager bulls, they will probably be eager to buy below the prior month’s low. Consequently, the downside risk is probably limited to a 1 – 3 bar (month) pullback. Since the bars are about 80 points tall, a pullback below a prior month’s low would be at least 80 points. A pullback will probably go more than 1 tick below the prior month’s low. Therefore, the pullback will probably be at least 100 points and about 5%.
Biggest buy climax in S&P500 cash index in 70 years
I mentioned that the S&P500 cash index had another 13-bar pullback in the past 70 years. It might be more than 70 years, but that is as far as I checked. That was in 1995 at the start of the biggest bull trend in my 30-year trading history. The pullback lasted one month and it was about 4%. Since the current micro channel is late in a bull trend and not at the start, the odds are that this pullback will be at least as deep. In addition, it will probably last a little longer.
However, even if it is much deeper and longer, the bulls will buy it because the bull trend is so strong. This is true even if the Emini falls 20% over the next 6 months, which is unlikely.
Weekly S&P500 Emini futures candlestick chart:
Extreme buy climax
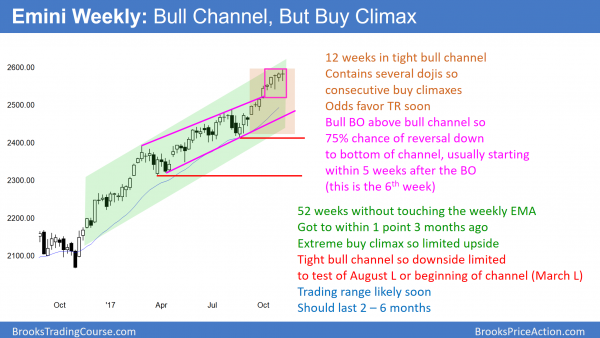
The weekly S&P500 Emini futures candlestick chart has been in a tight bull channel for 12 weeks. This is a strong bull trend. However, it has a series of bull bars separated by dojis. This is a consecutive buy climax pattern. In addition, the Emini has not touched its 20-week exponential moving average in 52 weeks. In a buy climax, every bar is a sell signal bar for the next week.
The S&P500 cash index was been above its 20-week moving average for 62 weeks in 1995. That stretch was the longest in the past 70 years. The current streak is 52 weeks, and it is the second longest in 70 years. The weekly Emini chart has never been this overbought in its 18-year history. While it got close to its 20-week EMA in August, it did not touch it.
Although the market never has to touch its average, it always eventually does. Therefore, the odds are that a pullback will begin soon. The politics surrounding either Trump’s tax reform including tax cuts or the budget vote could be the catalyst for a reversal. This is also the end of a great earnings season, and many bulls will take some profits before the end of the year. Yet, until there is a strong reversal down, the odds continue to favor at least slightly higher prices.
Daily S&P500 Emini futures candlestick chart:
Wedge top in buy climax
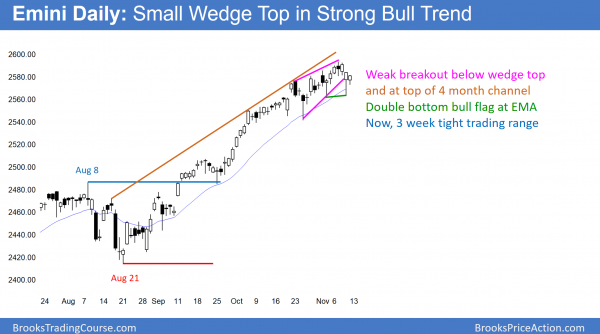
The daily S&P500 Emini futures candlestick chart broke below last week’s small wedge top. It is now in a 3-week tight trading range. Friday was a bull inside bar above the moving average. It is a buy signal bar.
The bears have been selling new highs during this 3-week wedge rally. In addition, the bulls have been taking partial profits at new highs. With both the bulls and bears selling high, the odds are increasing that the bull trend is evolving into a trading range. However, if the bulls get a strong breakout above the high, they have a 40% chance of a quick measured move up.
Prior to the current rally, the daily S&P500 cash index has not gone more than 241 days without a 3% correction in 90 years. It has now gone 251 days. Like the weekly and monthly buy climaxes, this is extreme. However, until there are consecutive big bear bars, the odds are that the bulls will continue to buy every selloff.
Yet, everyone knows how extreme the market is. As a result, once it begins to correct, the bulls will be very quick to get out. That increases the odds that the 5% correction could be very fast.


