

I am suddenly concerned about the bullish case for this market. But is that wise in a market ruled by robots? asks technical expert Joe Duarte, editor of In the Money Options.
What I mean is that every time my gut, my market experience, and tried and true technical indicators have told me to buy puts and to hedge my portfolio over the past twelve months, it’s actually been yet another buying opportunity. So why should this time be any different?
Regular readers are familiar with the major influence in this market, robot trading algorithms. The computer generated trading programs, aka algos, read headlines and use basic technical analysis to execute trades and in the course of events have managed to turn traditional fundamental and technical indicators into mere topics of conversation instead of what they once were: reliable components actionable warning and trading systems.
But over the last couple of weeks something seems different in the market. So the question is whether something has changed in the programs.
Consider this. For the past twelve months, as the headlines suggested that the Trump agenda would succeed, the algos have been buying stocks on every single dip. But as the headlines are changing – “Trump has yet to deliver on his promises” – the robots may be having a change of heart.
Here is a recap. Over the past few weeks I’ve remained bullish on the market. Moreover, I’ve recently described a scenario which suggested the possibility of new highs in stock prices due to the general behavior of robot algorithm trading programs and the usually bullish seasonality of the calendar months of November and December for stock prices.
Get Trading Insights, MoneyShow’s free trading newsletter »
At the same time I raised the question of whether the most accurate indicator over the last few years, the New York Stock Exchange Advance Decline line (NYAD) was starting to weaken.
Specifically, last week in this space along with my bullish note, I noted: “I do want to point out that for the past two weeks, the S & P 500 has made higher highs but the NYAD has not.
This may be the beginning of a significant divergence. When the NYAD does not confirm the action in the major indexes, it is usually a signal that the rally is starting to struggle.”
Well, the other shoe may have dropped as the NYAD has actually rolled over and may be in the early stages of a bearish pattern even as the major indexes are still very near their all time highs. But then again, it may not mean anything as only the robots know what’s next.
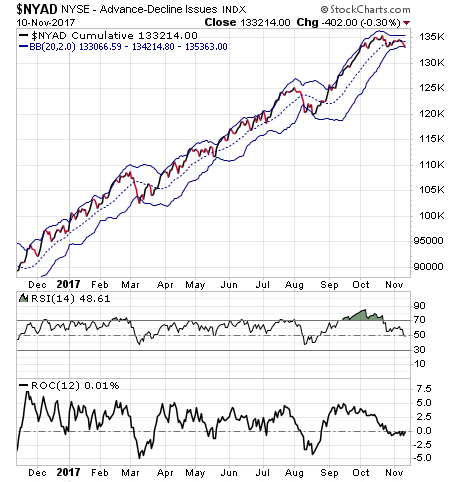
Given the suddenly bearish turn in the NYAD, I am now officially concerned about the intermediate term up trend and the possibility of a swift reversal to the down side. Consider the following three findings on the NYAD chart.
First, NYAD topped out in mid October, even as the S & P 500 made marginal new highs. Furthermore, NYAD is now making lower lows and lower highs, a bearish pattern. Next, NYAD is now below its 20-day moving average and hugging the lower Bollinger Band (blue lines above and below NYAD).
If this pattern is not reversed, NYAD will most likely start to slide down a falling B-band which will serve as a greasy and slippery slope.
Second, the RSI indicator seems to have failed to bounce at the 50 area. If this is not reversed, the most likely course of action is for RSI to fall to the oversold area before attempting a bounce.
And third, the ROC is starting to turn up. This indicator signals the rate of momentum in the market. And given the status of the RSI and the NYAD, the odds seem to favor an acceleration of momentum to the down side.


