

I expect a Santa Claus rally to end the year. The main variable outstanding: tax cuts. If the tax plan passes, the Santa Claus rally will likely be stronger. If they aren’t, then we could have our first correction of the year, writes Don Kaufman, co-founder of TheoTrade.
The GOP had a big win as the House passed the tax legislation 227 to 205 as 13 Republicans voted against the bill, but that wasn’t enough to stop it.
In the summer, the healthcare plan passed with a closer margin implying a similar plan has a better chance of passing in the Senate than the failed healthcare reform plan. The Joint Committee on Taxation said that the plan would add $1.4 trillion to the debt over 10 years which means it leaped over a key hurdle. The limit it can add to the debt ceiling is $1.5 trillion.
As we have discussed, some people will be getting a tax increase. The JCT said some of those earning $20,000 to $50,000 will be getting their taxes raised after 2019. This likely will depend on if those taxpayers live in a high tax state or not.
States like New York, New Jersey, and California, which have high income tax rates will see their residents get a tax hike. That’s why all but one of the votes in the GOP against this plan were from New York, New Jersey and California. The good news for the Senate plan’s odds of passing is that no Republicans are from those states.
On the PredictIt website, the chances of an individual tax cut passing by the end of the year are 27% and the chances of a corporate tax cut passing by the end of the year are 34%. These results haven’t changed much.
I think we will get a good idea what will happen when the Senate gets closer to voting on the plan. The goal is for the Senate to vote on it in the last week of November. That is the do or die moment for the plan. It doesn’t mean the market won’t be able to react to the plan in the next few days. It will react whenever changes are made and whenever key Senators make statements about their vote.
So far, Ron Johnson has said he will vote against the plan, but wants to make fixes so he can vote for it. He thinks corporations will benefit more than small businesses. The repeal of the individual mandate for Obamacare has been added back into the potential plan which is something that concerns Senator Susan Collins who is a moderate when it comes to healthcare.
The big problem is that even if the plan passes the Senate, the two chambers will need to come together to hash out their differences. If the Senate passes the plan, it will do so by one or two votes. It will be easy to lose those votes when the House starts the negotiation because the House is more conservative than the Senate. The chart below gives a great summary of the differences between the plans.

High yield is fine
I don’t think the House passing the tax reform bill had any relation to the stock market rising on Thursday. It was probably a coincidence. High yield debt also increased along with stocks.
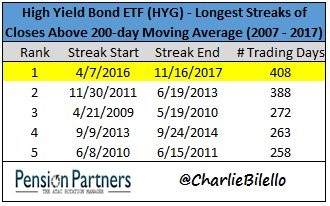
The iShares iBoxx $ High Yield Corporate Bonds ETF (HYG) index was up 0.98%. The total selloff was 2.34%. After this rally, it’s now 1.39% off its recent high in September.
The chart below shows the short history of streaks where the HYG has been above its 200-day moving average. As you can see, this current streak is 408 days. That’s the longest in the past 10 years.
It’s remarkable to hear the bears clamoring about such a small selloff. I guess that’s just because there has been nothing exciting for the bears this year in what will be considered the quietest one ever. With today’s rally in stocks, the CNN Fear & Greed Index of investor sentiment is at 50 which means it’s perfectly neutral. That is shocking to me as the S&P 500 Index (SPX) is 0.34% off its record high and there hasn’t been a correction this year.
Summary of where the market is
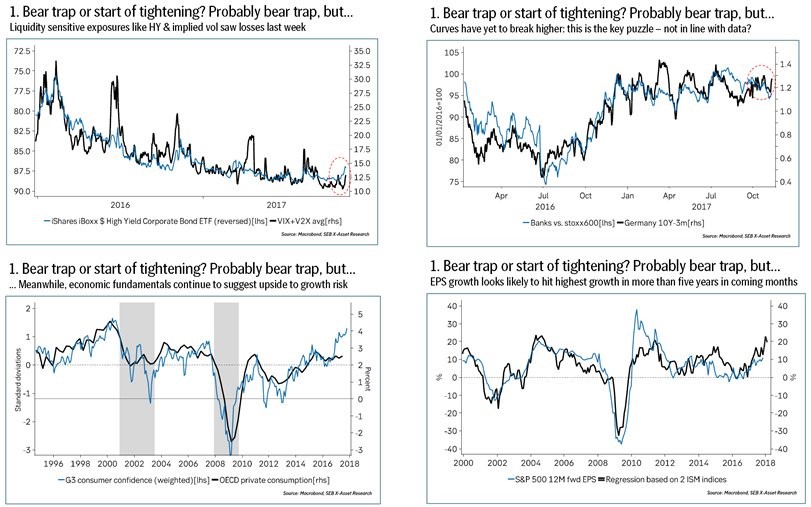
The four charts below give us a quick summary of the trading situation.
The first chart shows the recent selloff in high yield bonds and the increase in implied volatility from extremely low levels.
The second chart shows the German yield curve and the bank stocks versus the European index. The yield curve hasn’t moved higher even though there have been good economic reports.
The third chart shows the G3 consumer confidence index compared to the OECD private consumption index. The consumer confidence has ramped to the highest point since 2000, but consumption hasn’t risen much. Considering how much consumer confidence has risen in America, I am interested to find out what happens when wage growth accelerates in 2018. It’s possible consumers might be confident because there hasn’t been a recession in a long time.
The fourth chart shows the S&P 500’s 12 month forward EPS as compared with a regression of the two Institute for Supply Management indices. The chart suggests the fastest EPS growth in 5 years is coming, but I have my doubts as there will be tough comparisons in the first half of 2018. It’s also worth noting that the ISM forecasts have been wildly optimistic for GDP growth, so I wouldn’t expect them to be perfectly accurate in the next few months. There has been a high historical correlation between ISM and earnings growth, so I could be wrong.
Conclusion
I expect a Santa Claus rally to end the year. The main variable outstanding: tax cuts. If they are passed, the Santa Claus rally will likely be stronger. If they aren’t, then we could have our first correction of the year.
The final details of the plan will help us figure out if taxes are actually cut on the middle class. It seems as though some analysis has been done which shows some people will get a tax increase, but there have been so many versions of the plans it’s tough to say what the final legislation will do.


