

As overbought as the market is, traders have to be ready for another leg up. If there is a strong breakout to a new high and a good follow-through bar, odds would favor the measured move up before the bears would try again to reverse the buy climax, asserts Al Brooks.
Monthly S&P500 Emini futures candlestick chart:
Trump’s tax cut vote is catalyst for 5% correction
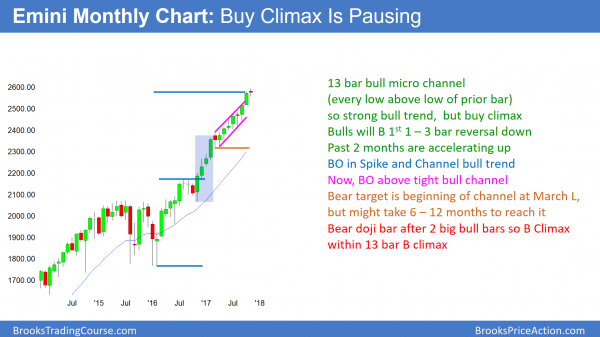
The monthly S&P500 Emini futures candlestick chart has a small bar so far this month. Every bar for the past 12 months has a low above the low of the prior bar. That is a 13 bar bull micro channel and a sign of strong bulls. It is also unsustainable and therefore climactic.
The monthly S&P500 Emini futures candlestick chart is in a 13 bar bull micro channel. This has happened only once in the S&P500 cash index in the past 70 years and never in the 18-year history of the Emini. The monthly S&P500 cash index chart has never had a 14 bar bull micro channel. While the micro channel can continue to grow, it is already extremely unusual. Therefore, the odds are that the monthly chart will soon begin to behave as it has done throughout its history. This means that there is a 90% chance of a pullback within the next few months.
A pullback is a bull flag, not a trend reversal
A pullback simply means that a bar falls below the low of the prior bar. The bulls have been so eager to buy that they have not waited for pullbacks. They have been so confident that the market was going up that they were afraid to miss the move. Therefore, the monthly bulls have been buying at the market and on any dip during every month.
Once a bar falls below the low of the past month, they will finally be able to buy a pullback. When they have been as aggressive as they have for the past year, there is a 70% chance that they will buy the first pullback before it grows to more than 3 bars (months).
Since the bars on the monthly chart are about 80 points tall, a pullback could easily be 100 points. That is close enough to a 5% correction so that it would probably continue down to about 5%. In addition, the one other time that the S&P500 cash index had a 13 bar bull micro channel, the pullback was a little more than 4%.
Since that was in 1995 at the start of a huge bull trend, the odds are that the current pullback will be at least as big. Also, that pullback only lasted 1 bar. The upcoming pullback might last 2 – 3 bars, but probably not much longer.
How much of a rally after the bull flag?
A pullback means that the bull trend will probably resume and not reverse. It is a bull flag. When there is a first pullback in a micro channel that lasts 10 or more bars, the rally above usually lasts at least 2 – 3 bars. Therefore, the odds are that the pullback will lead to at least a 2 – 3-month rally.
However, the micro channel is a buy climax. Consequently, there is a 50% chance that the rally above the bull flag will then soon enter a tight trading range for 5 – 10 bars (months).
Weekly S&P500 Emini futures candlestick chart:
53 weeks above 20-week EMA so buy climax
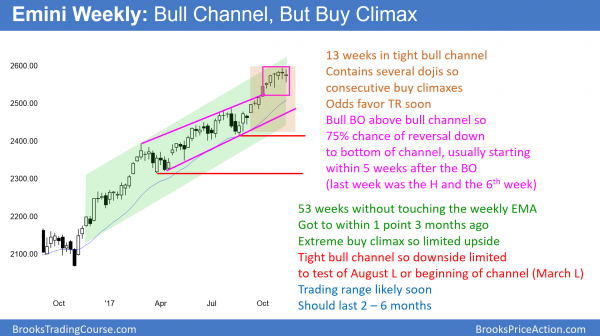
The weekly S&P500 Emini futures candlestick chart has not touched the 20-week exponential moving average in 53 weeks. While this means that the bull trend is strong, it is also climactic. By trading below last week’s low, the Emini triggered a sell signal. But, the sell signal bar and the entry were both weak. Therefore, this is so far a low probability sell.
The weekly S&P500 Emini futures candlestick chart has not touched its 20-week EMA in 53 weeks. This has never happened in the 18-year history of the Emini, and it is extreme behavior. The odds favor a return to typical behavior before it becomes much more extreme. That means that the odds favor a pullback to the 20-week EMA beginning before the end of the year.
The S&P500 cash index’s longest streak was in 1994 – 1996. It stayed above the 20-week moving average for 62 weeks. When it reached the moving average, the bulls were waiting. Whenever a market stays above its 20 bar EMA for 20 or more weeks, the bulls are strong. When it finally pulls back to the average price, that creates a 20 gap bar buy signal. There was a gap between the low of every bar and the EMA for 20 weeks. The bulls are usually eager to finally buy at an average price.
The first pullback to the 20-week moving average was in 1996. It lasted for one week. However, the pullback became the middle of a 7-month tight trading range. The bull trend resumed and the rally from 1995 tripled the price of the S&P500 in 5 years. While that big of a rally is very unlikely now because the current bull trend has already lasted 8 years, the odds are that the Emini will go at least a little higher after the pullback.
Weekly sell signal
Since the weekly chart is far above its 20-week EMA and in a buy climax, every bar is a sell signal bar. This is because the odds of a reversal back to below the 20 week EMA are high. This week triggered a sell signal by falling below last week’s low. However, last week was a doji bar. That usually would not lead to a strong reversal down. This week was the entry bar. It had a bull body, and it is disappointing for the bears. As a result, the sell signal so far is weak. The odds continue to favor more sideways to up trading, even though a reversal down will probably begin by year-end.
Because this week was a pullback in a bull trend and it was a bull reversal bar, it is a buy signal bar for next week. However, many bulls want to buy much closer to the 20-week EMA. Furthermore, the past four weeks have been in a tight trading range. Most breakouts from tight ranges fail. This further lowers the chances of a big rally next week.
Daily S&P500 Emini futures candlestick chart:
251 days without a 3% correction so buy climax
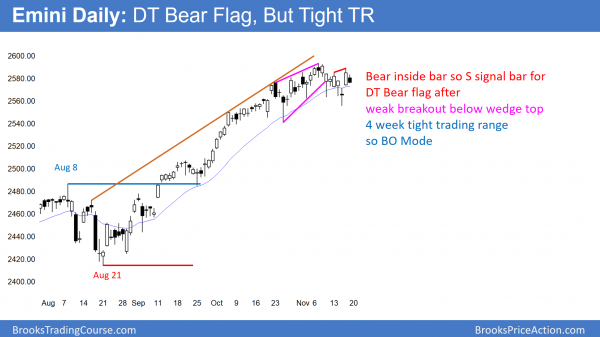
The daily S&P500 Emini futures candlestick chart had a single close below the 20-day exponential moving average on Wednesday. However, the bull trend resumed on Thursday. Until there is a strong breakout above or below the month-long trading range, the odds are that it will continue.
The daily S&P500 Emini futures candlestick chart is in a strong bull trend. It has not had a 3% correction in 251 bars. The longest prior streak in the past 90 years was 241 bars. Since markets are reflections of rational human behavior, tendencies repeat. Therefore, the odds are against the current streak growing much longer.
owever, there is a true adage on Wall Street that says that a market can continue in an irrational way longer than you can remain solvent betting against it. This means that the odds continue to favor failed reversals and at least minor new highs.
Buy climaxes usually lead to trading ranges, not bear trends
Since the buy climaxes on the daily, weekly, and monthly charts have never all been this extreme, traders should expect exhaustion. Exhausted bulls take profits and wait to buy lower. The bears usually cannot create a bear trend without first forming a trading range. Therefore, the first reversal down on the weekly and monthly charts will be minor. On the monthly chart, it will probably be a bull flag. If that pullback lasted 2 – 3 months, it would result in a trading range on the weekly chart.
It could also lead to a bear trend on the daily chart. I said that a bull trend usually has to evolve into a trading range before reversing into a bear trend. Since the daily chart has been in a trading range for about 20 bars, there is enough selling pressure for the bears to take control at any point. However, until there are consecutive big bear bars on the daily chart, the odds are that the bulls will buy every reversal down. Furthermore, once there are consecutive big bull bars, the correction will probably already be about half over.
Every breakout usually has a catalyst
News happens many times every day. Reporters claim that every move up or down is directly caused by the news. That is ignorant. The market reverses because it has gone too far. It always reverses at support or resistance. There is often a news item that triggers the reversal, but if a bear trend follows, it was caused by traders concluding that the rally went too far and now needs to find how low is too low.
Some catalysts are predictable. For example, if there is a problem with the tax or budget bills, everyone knows the market might sell off. Others are entirely unexpected, like 9/11.
Most often, after the reversal begins, reporters then claim that the news of that day caused the bear trend. That is nonsense. There are bear news items every day. Traders should not sell simply because of the news. The momentum up is far more important. Until there is strong, sustained momentum down, traders should assume that the bull trend will continue.
Once there is a strong reversal, traders should not buy when there is bullish news. There is bullish news every day. Trade the trend, not the news.
Target for the bears is the August 8 high
The target for the bears is the August 8 high. That is a breakout point. While it was tested on September 25, the test was only a doji. That is usually not a strong enough test. Consequently, traders will want to see it tested one more time. That would be a 5% pullback to below 2500. However, until there is a top and a strong reversal down, the odds continue to favor at least slightly higher prices.
Bull breakout of a wedge top?
Everyone knows that the stock market is overbought. Yet, buy climaxes often last longer and extend higher than what seems reasonable. Every top has failed since the bull channel began in March. The bears have stopped the bulls for a month, but the bear breakout attempt failed this week. Therefore, traders have to be thinking that if the market tried hard to go down and failed, maybe it will have more success going the other way.
As overbought as the market is, traders have to be ready for another leg up. A measured move up based on the 40 – 50 point tall, month-long trading range is around 2650. If there is a strong breakout to a new high and a good follow-through bar, the odds would favor the measured move up before the bears would try again to reverse the buy climax.


