

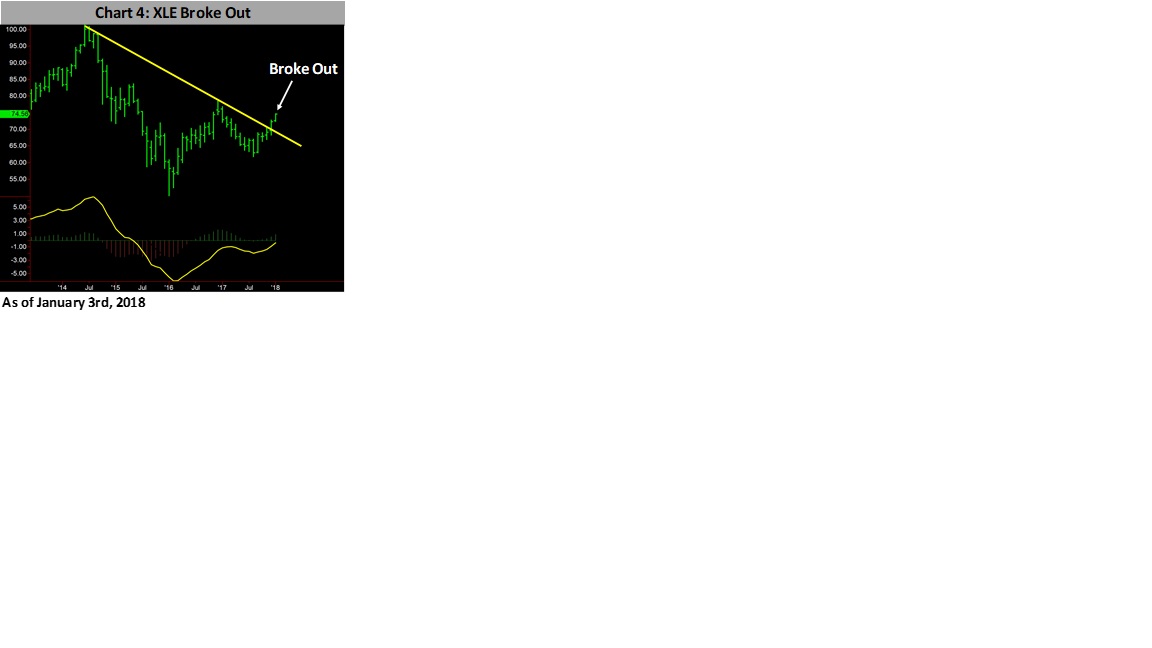
XLE broke out from the downtrend that started in 2014. A break out from a multi-year price weakness like this usually leads to a sharp rise which may be an indication that XLE could hit the target price of $95 quickly, writes Joon Choi of Signalert Asset Management.
The year 2017 turned out to be a stellar year for equities, as the S&P 500 Index (SPX) rose 19.4%, contrary to the most followed strategists’ average forecast of 4% appreciation for the index.
For the record, I was also in the camp of high single-digit gains for the index which led me to recommend covered call positions with 8-11% potential last year.
Looking back, I might have been a little cautious. However, I believe it’s unlikely that equities will see similar gains for 2018 as inflation may grab the headlines this year. Economies around the world are heating up which will likely force the Fed to raise the short-term rates more abruptly than anticipated.
I will discuss an investment idea for the New Year.
Overview
U.S. equities have benefited from the “Goldilocks” scenario (low inflation with modest growth) since the financial crisis which led to the ultra-low interest rate environment.
On the other hand, commodities have not fared as well for the same period because they tend to perform better during inflationary cycles. However, a commodity such as crude oil has seen sharp gains from its depressed level in 2015. In fact, oil has seen a first back to back annual gains in 2017 (45% in 2016 and 11% in 2017) since 2011.
Copper also saw first consecutive yearly gains last year since 2011.
Recommendation
Commodity play may become the best investment thesis for 2018. I believe the best way for the average investors to get a piece of the pie is to invest in Energy Select Sector SPDR ETF (XLE).
Fundamentally, stronger economic growth should increase demand for oil. Technically, the XLE monthly chart resembles the bullish pattern the ETF had back in 2010.
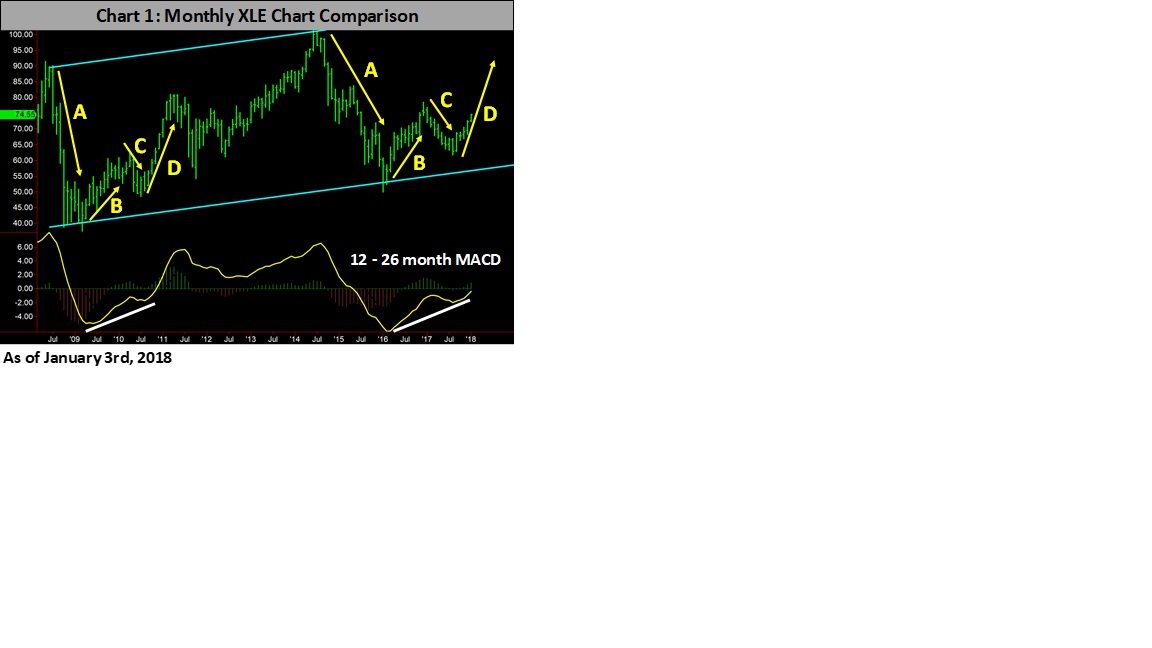
Chart 1 shows the similarity between 2008-10 and 2014-18. Point A reflects the severe selloffs, prices bounced sharply in point B, a correction at point C followed by a sharp price rise. In addition, the current MACD pattern resembles the one from 2008-10, a rising bottom.
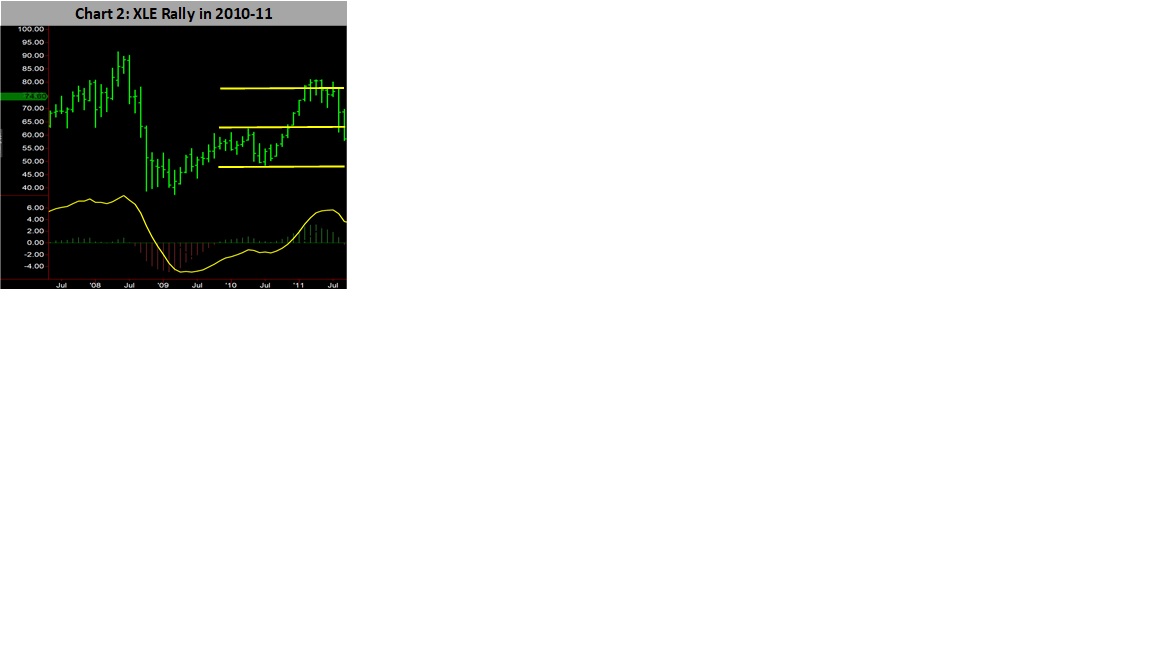
XLE broke out of its trading range in 2010 and rallied past another channel.
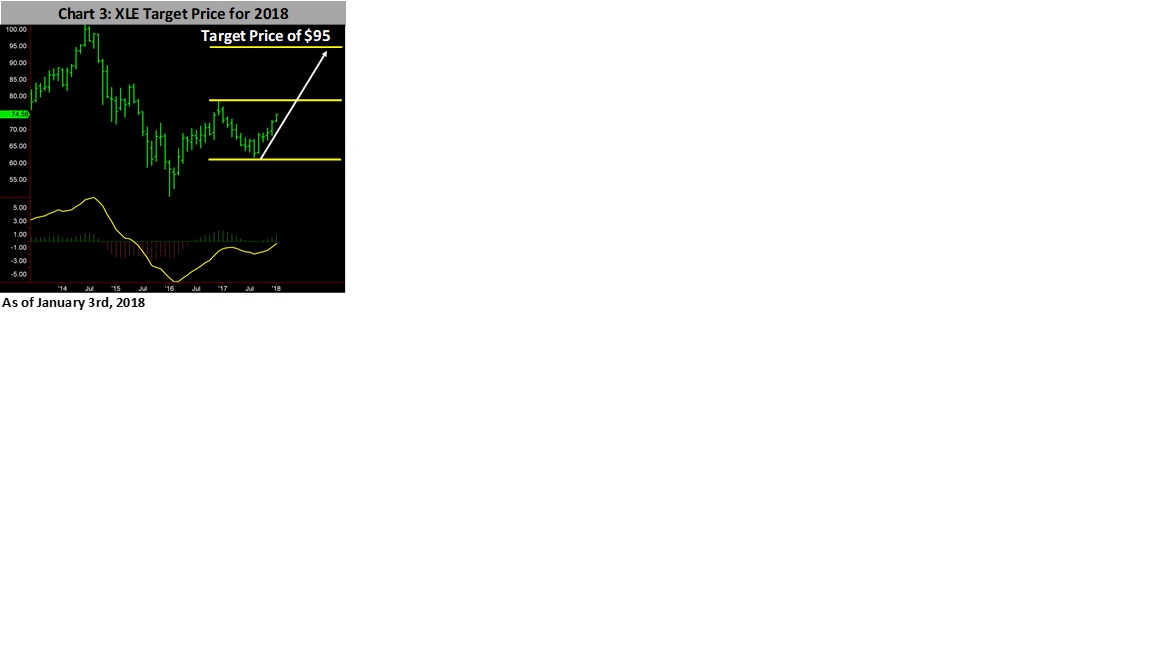
Using a similar technique from the previous instance, I am setting a target price of $95 for XLE (next channel up from current trading channel) which is 27% from current level.
Furthermore, as you can see in Chart 4, XLE broke out from the downtrend that started in 2014.
A break out from a multi-year price weakness like this usually leads to a sharp rise which may be an indication that XLE may hit the target price of $95 rather quickly, maybe even before the summer is over. Therefore, I strongly recommend increasing energy exposure in your portfolio.
We hope our investment insights prove to be helpful in the New Year.
Subscribe to investment newsletter Systems and Forecasts here…


