

I think of the speculation in cryptocurrencies as a signal the speculation cycle is near its peak, writes Don Kaufman, co-founder of TheoTrade.
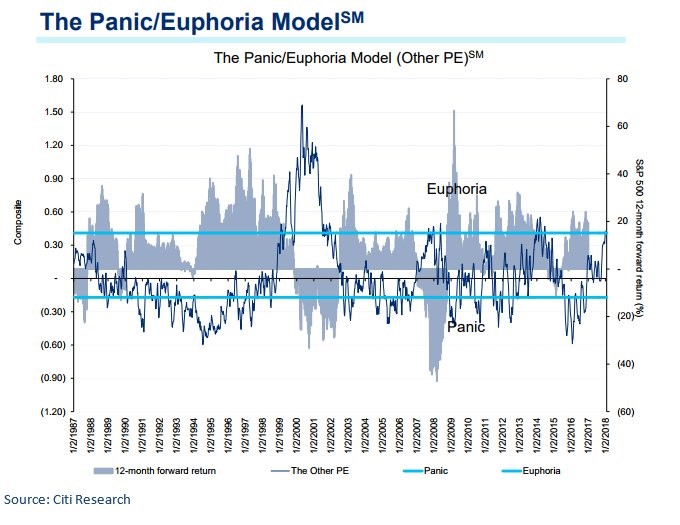
I’ve been discussing the near-term exuberance the market has been experiencing this week. I still think 2018 will be a good year, but there’s a lot of euphoria in the market. As you can see from the Citi Model, the stock market is exhibiting a slight level of euphoria. It was slightly higher before the horizontal correction from 2015-2016.
There was a similar level of euphoria before the great financial crisis. I think of the speculation in cryptocurrencies as a signal the speculation cycle is near its peak.
The other asset besides stocks and cryptos which is overbought in the near term is oil.
Brent is up over 10% from the lows in December. With WTI at $61.95, it is near the May 2015 high. The Iranian protests, which I haven’t discussed in articles, have been driving oil higher in the past few days.
American commercial crude inventories are at 424.46 million barrels which is 20% lower than the peak in March 2017 and near the 5 year average of 420 million barrels.
It’s important to focus on the negatives with the price of oil this high.
The most obvious negative is the high level of net longs. Another negative is the fact that the Iranian protests haven’t shut down any oil production. If you look at geopolitics from an economic perspective, it’s not surprising to see unrest in the Middle East with oil prices low. The higher they go, the easier it is for the government to quell the people with benefits.
The other obvious negative for oil prices in the medium term is the fact that higher prices encourage U.S. production growth. Production beat the 2015 peak in October and is expected to set records later in 2018.
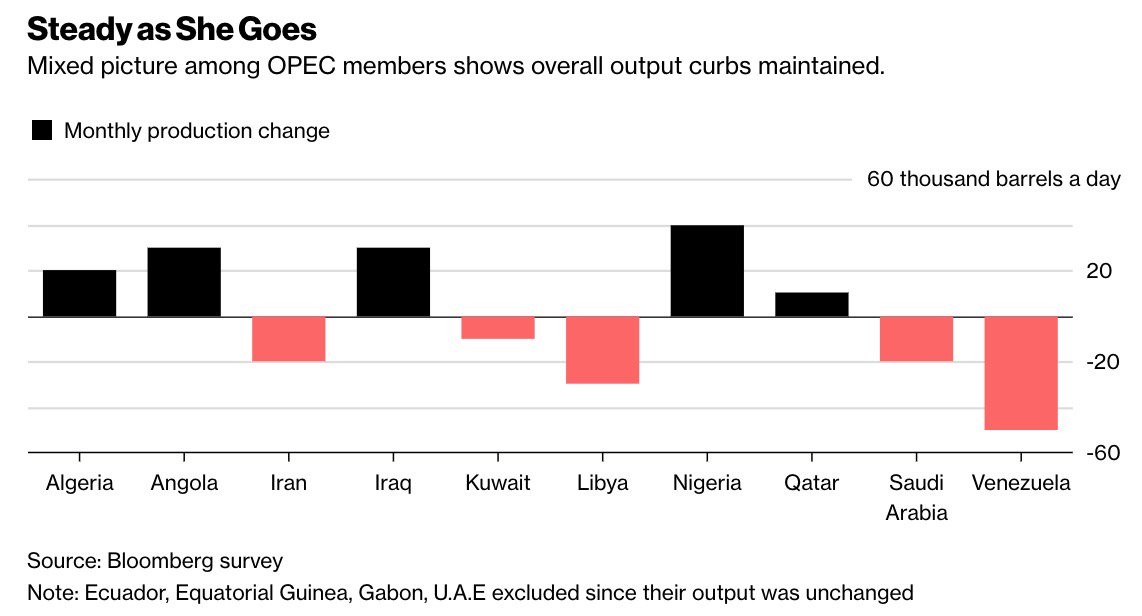
The OPEC cuts are also expected to end soon. As you can see from the chart below, although they got off to a rough start, the latest results show that countries are holding steady with their production cuts.
On the positive side, it’s possible the oil market stays overbought just like it did in 2007 before the financial crisis. That would be consistent with a very sharp run-up in inflation this year.
Energy analyst Tom Kloza: Crude oil spike is on borrowed time.
Hard data improving
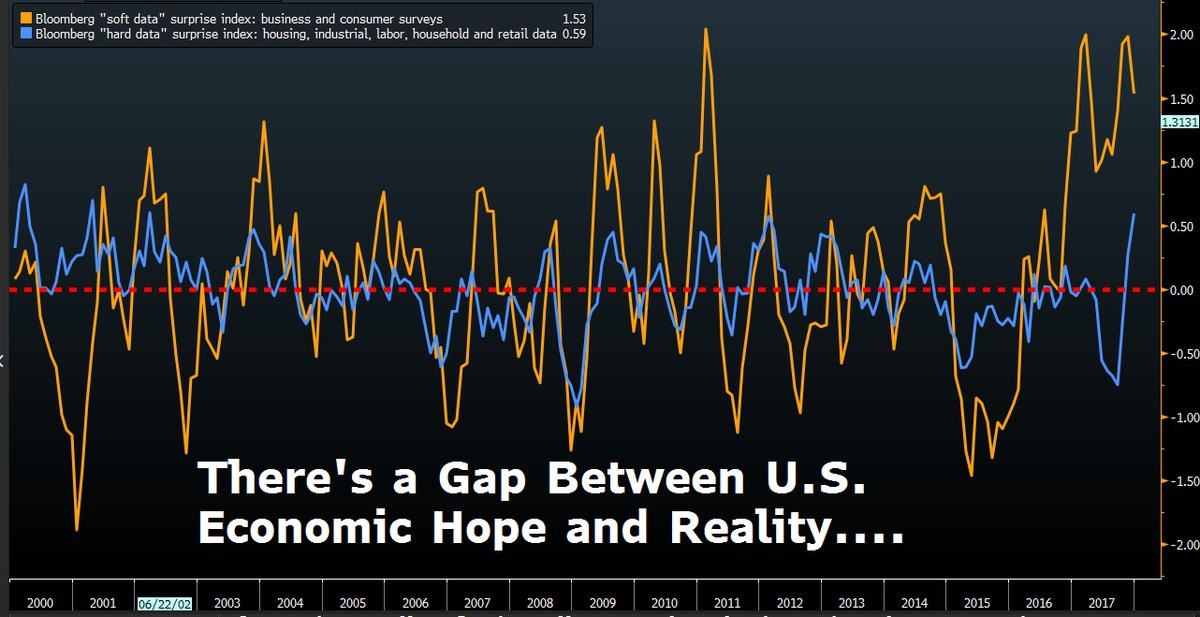
One of the themes I’ve mentioned we’ll see in 2018 is that hard economic data, which reflects actual production, will catch up to the heightened soft data, which is survey data. As you can see, in 2017 the soft data was near the highest in the past 17 years.
Lately, the hard data has improved to match the soft data as it’s also near the highest point since 2000. As a result of this strong economic data, the Atlanta Fed GDP Now is forecasting 3.2% GDP growth in Q4 as of the latest reading on January 3. The NY Fed GDP Now is showing 3.87% growth in Q4 and 3.15% growth in Q1. The St. Louis Fed is also optimistic about Q4 as the GDP growth rate is expected to be 3.01%.
Inflation theme playing out
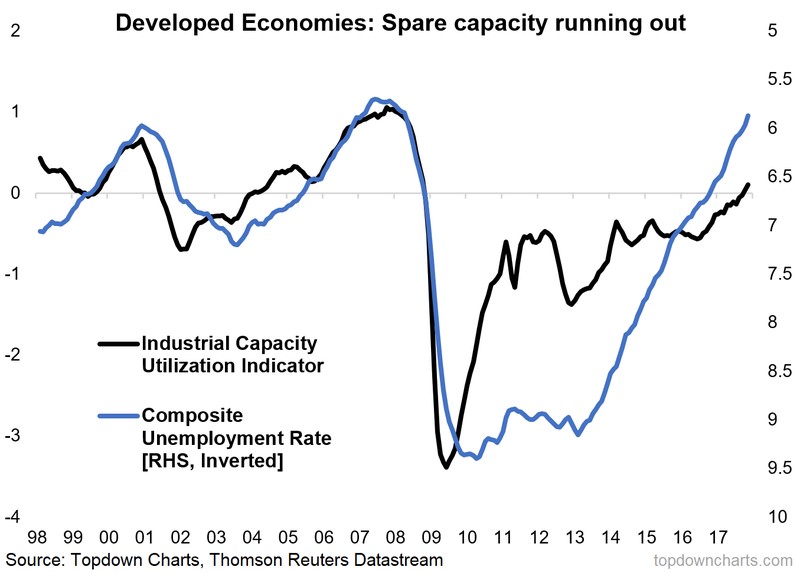
The other theme of 2018 is increasing commodity prices. As you can see from the chart below, the composite unemployment rate for developed markets has fallen to about 6.5%. The industrial capacity to utilization rate indicator has increased above 0. In the past, these two variables have combined to show the slack in the economy before inflation starts to increase.
This indicator is showing the same signs as the output gap and the difference between the U3 and U6 unemployment rate. Other indicators like the yield curve and the real Fed funds rate show there could be a recession in 2-3 years. That would indicate we’re approaching a late cycle phase where inflation increases.
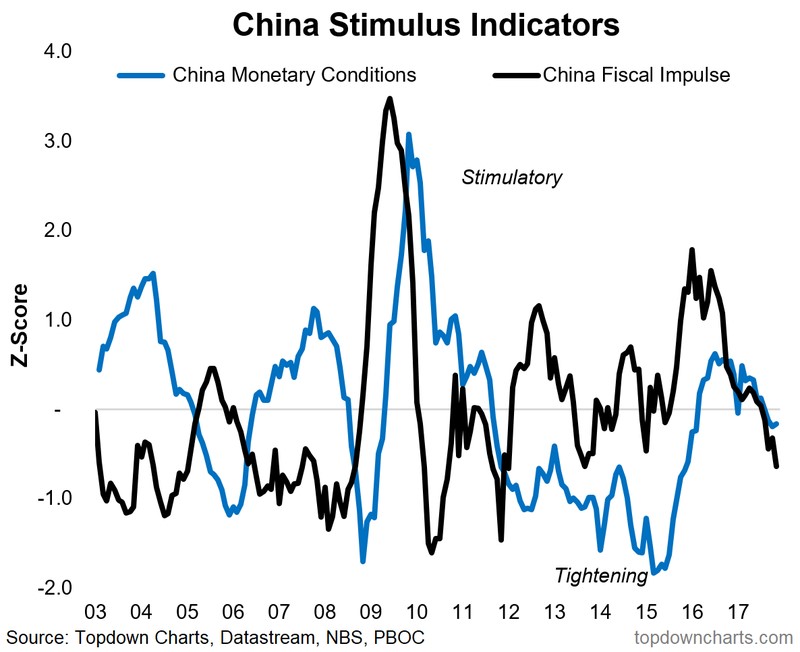
China weakness coming?
Prognosticators have predicted an acceleration in Indian growth and a deceleration in Chinese growth. Since the improvement in China was partially responsible for the global synchronized economic improvement in 2017, India needs to pick up the slack to keep the economy going.
To support the notion that China will have a rough year, the chart below shows the fiscal and monetary conditions. Both are now tightening which means the economy won’t have much support from the government. This isn’t that surprising because, as I mentioned in 2017, the government wanted the economy to be strong in a year where the 19th National Congress of the Communist Party took power.
Now that it is over, the punch bowl has been taken away and economists will once again wonder whether the growth decline will have a hard or soft landing.
Manufacturing reports show strength in December
The Markit and ISM manufacturing reports for December both showed fast growth.
In the Markit survey, the output expanded at the fastest pace in 11 months. The rate of job creation was the fastest since September 2014. The headline number increased from 53.9 to 55.1. The rate of new business received increased to a 10-month high. In keeping with the inflation theme, the input cost inflation accelerated for the second month in a row. The rate of increase was the second-fastest since December 2013. One of the reasons for input price inflation was the increased demand for raw materials which put pressure on the supply chain, leading to delays.
The ISM Manufacturing PMI was 59.7 which is the second highest in the past 12 months and higher than the 12-month average which was 57.6. This average is equal to 4.5% real growth. With overall growth lower than 3% in 2017, the growth clearly didn’t meet that estimate.
The PMI for December is equal to an even more ridiculous GDP growth rate of 5.2%. As I mentioned earlier, the GDP growth will likely be slightly above 3% in Q4 which is fast. A chemical products company said, “Our business is moving higher into the new year. Increased sales are resulting in increased purchases of CapEx and raw materials.”
There is expected to be an increase in CapEx this year. As I’ve showed, the 5 regional Fed surveys all show a pickup in CapEx in 2018. This might drive productivity growth and will certainly boost economic growth.


