

Presuming most of the corporate earnings announcements continue to show positive growth and optimistic future guidance, we may safely assume a continuation of this bull market. But that worries me, says Kerry Given, PhD, founder of Parkwood Capital.
It is interesting that passage of the tax bill near the end of the year resulted in a flat, sideways market. It seemed as though the tax cuts were already priced into the major market indices.
But something happened over the holidays. The champagne must have still been flowing Tuesday morning as the market opened in the new year. The S&P 500 Index (SPX) jumped out of the gate and accelerated every day last week, closing Friday at 2743, up 19 points.
SPX gapped open higher at each opening this week. I have never seen anything like it.
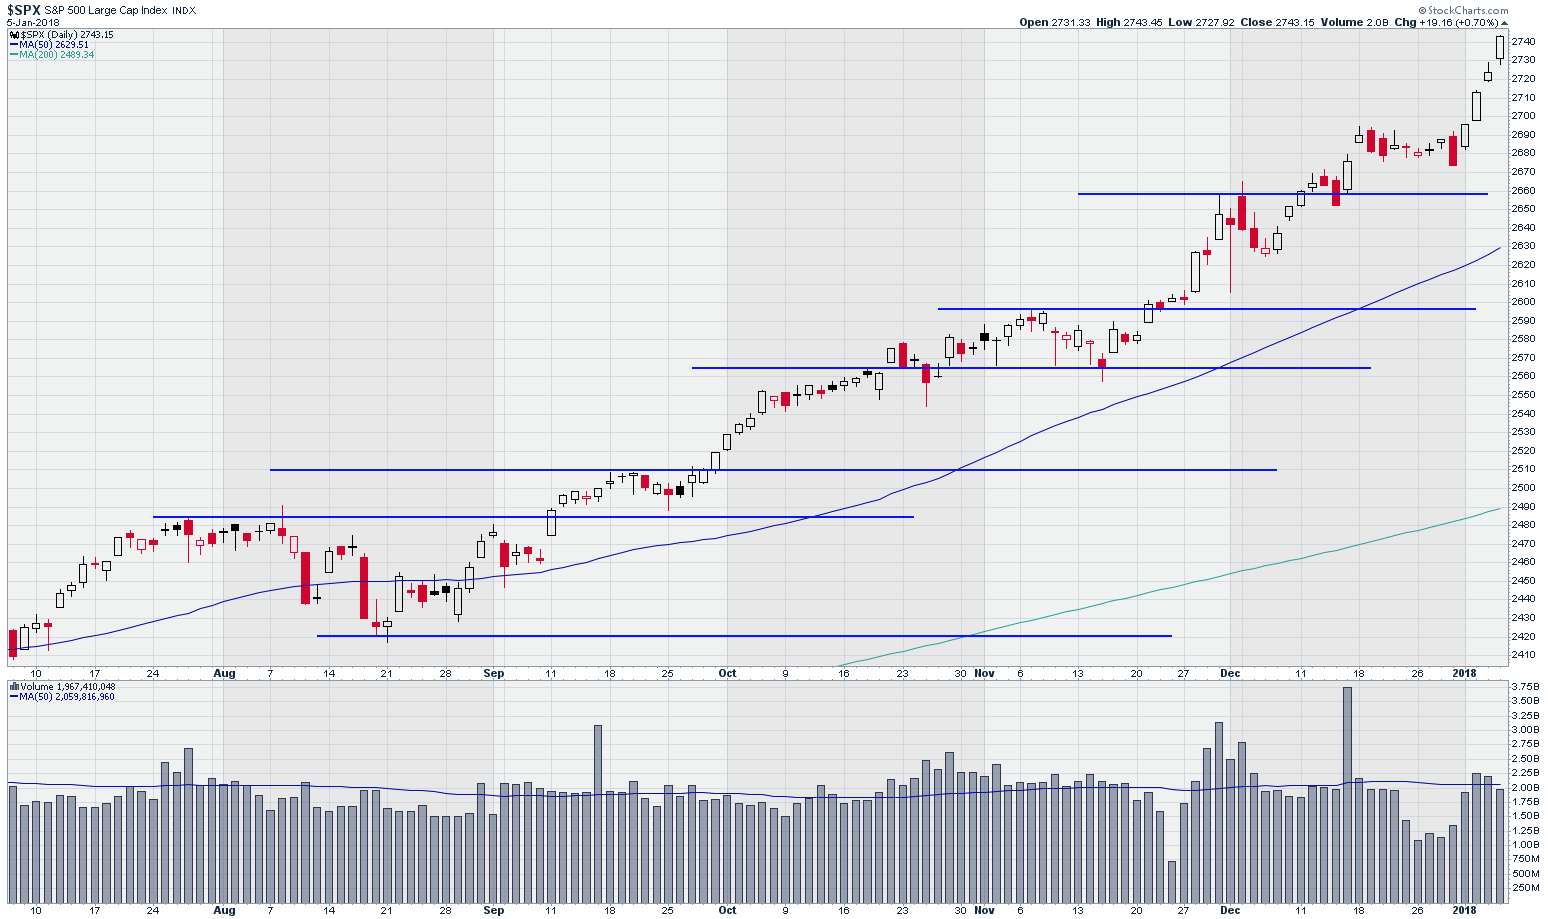
Standard and Poor’s 500 Index (SPX)
Chart courtesy of StockCharts.com
Trading volume in the S&P companies was above the 50-day moving average (dma) Wednesday and Thursday but fell off slightly Friday. The price action last week was classic strong bullish behavior: gap opening higher, a market unfazed by the Bannon/Trump squabble, and strong above-average trading volume.
I keep thinking this market has to take a breather at least, if not correct, but it keeps surprising me with its strength. Shorting this market is a fool’s errand.
Turning to the Bollinger bands drawn on the SPX price chart, we see that the market has remained above the 20 dma for the past four months and actually accelerated to close outside the upper edge of the bands Thursday. I suspect many market analysts were thinking that was just too much, but the markets fooled us once again, pushing even farther outside the bands Friday.
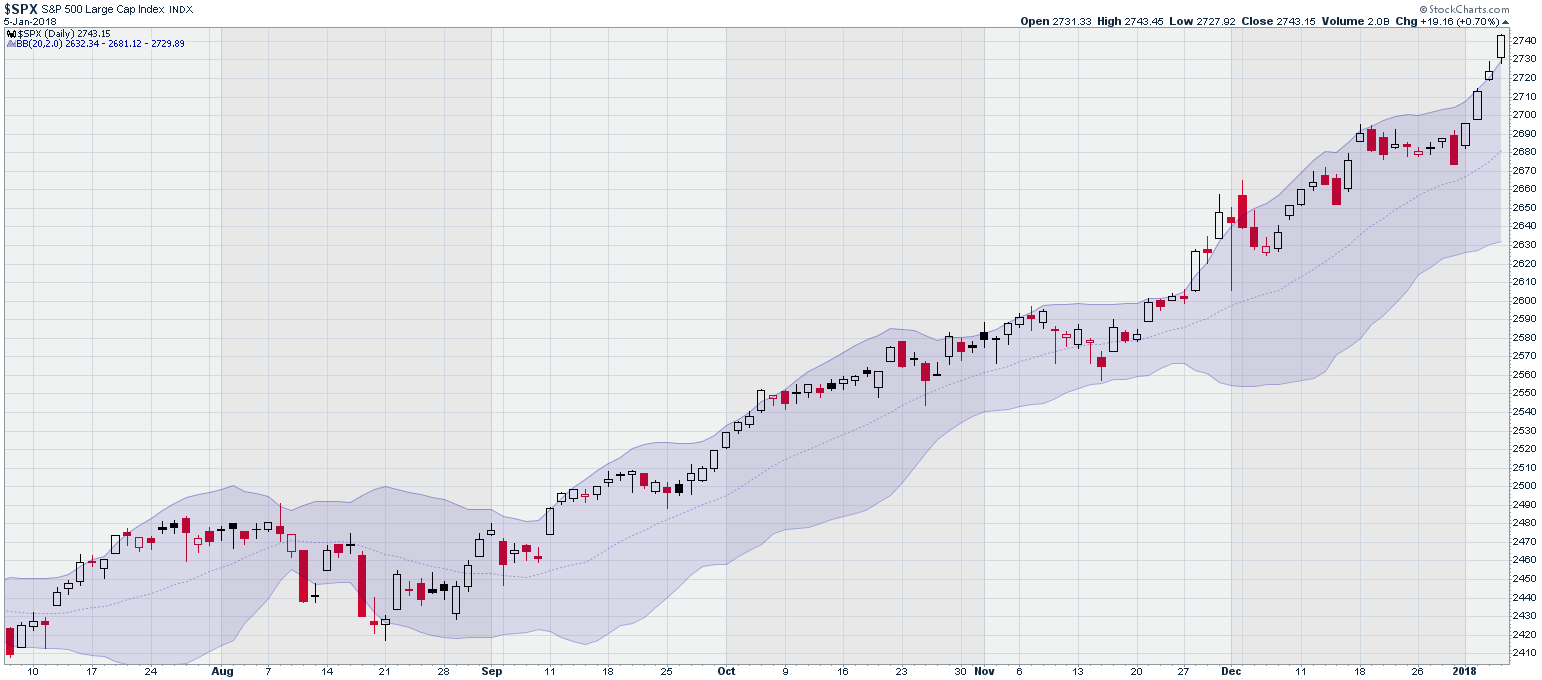
Standard and Poors 500 Index (SPX) with Bollinger Bands
Chart courtesy of StockCharts.com
The Bollinger bands are drawn with plus or minus two standard deviations around the 20 dma. This plot is based on the statistical fact that random data are expected to stay with the two standard deviation band about 95% of the time. On this basis, one might expect SPX to weaken a bit next week, but…
The Russell 2000 Index (RUT) closed Friday at $1560, a new closing all-time high.
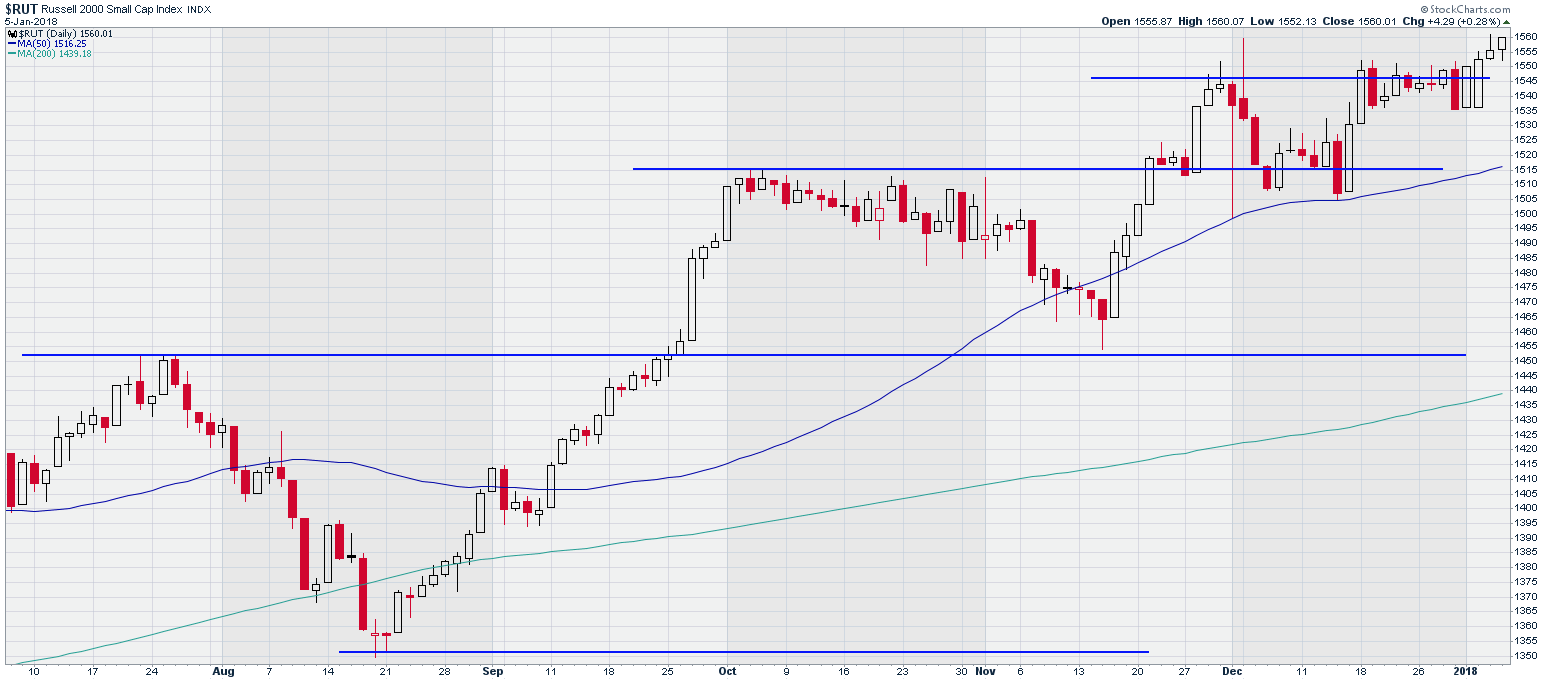
Russell 2000 Index (RUT)
Chart courtesy of StockCharts.com
RUT is the only major market index that has been trading somewhat more restrained. SPX and the NASDAQ have been setting new highs almost every day. All three indices closed at all-time highs Friday – think about that for a minute.
The NASDAQ Composite has also been gapping open higher all week, setting new all-time highs. NASDAQ closed at 7137, up nearly three percent in this four-day week! Trading volume in the NASDAQ composite companies ran parallel to
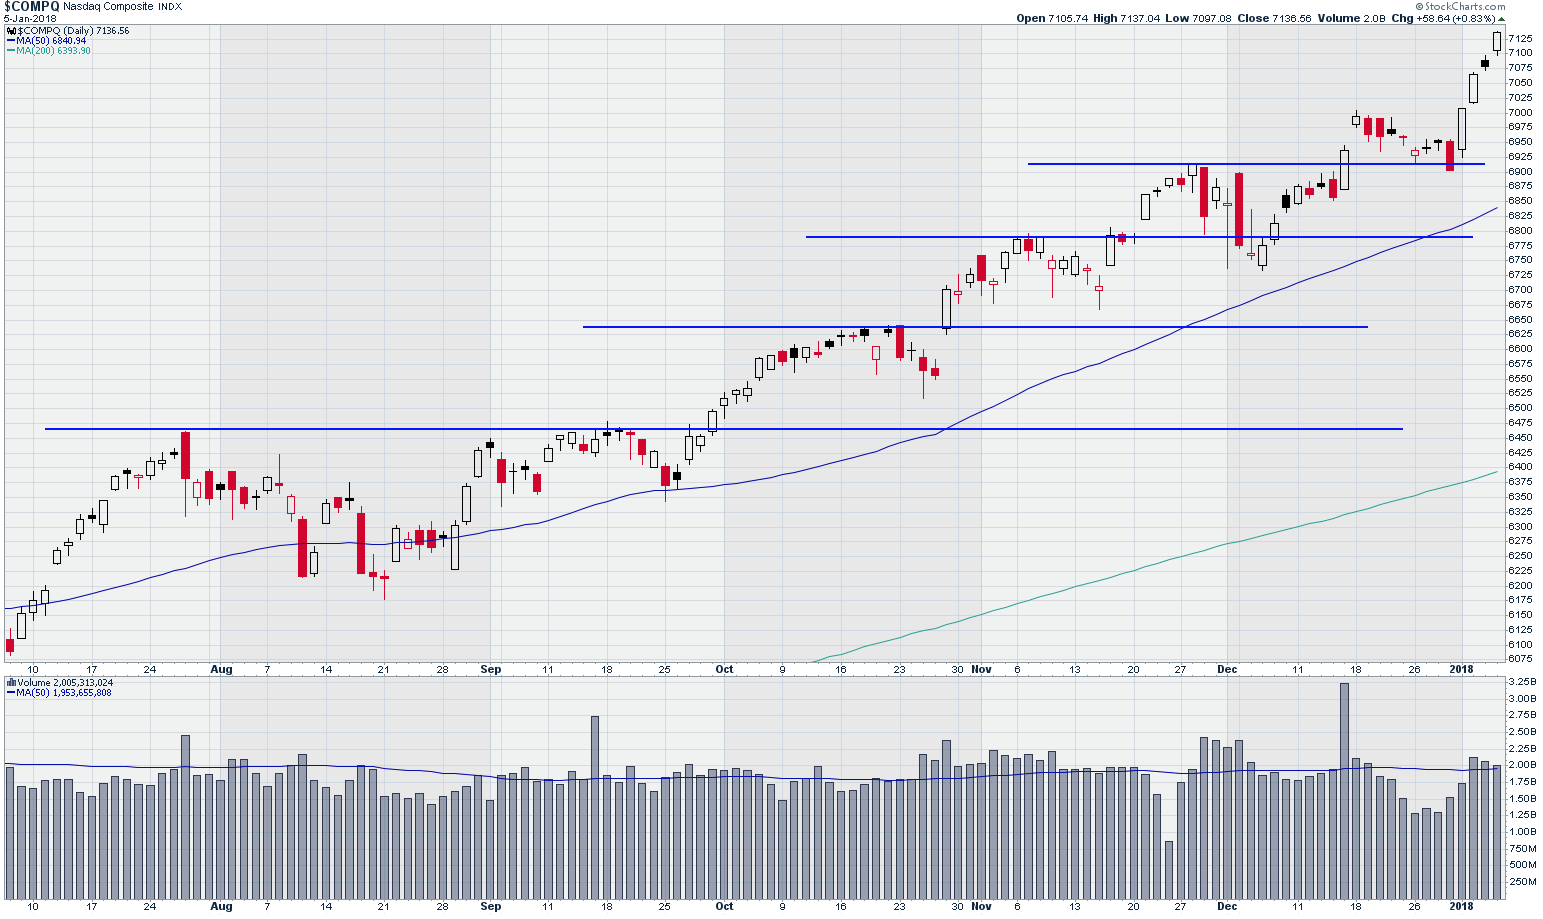
NASDAQ Composite Index
Chart courtesy of StockCharts.com
SPX, peaking Wednesday and coming down slowly towards week’s end.
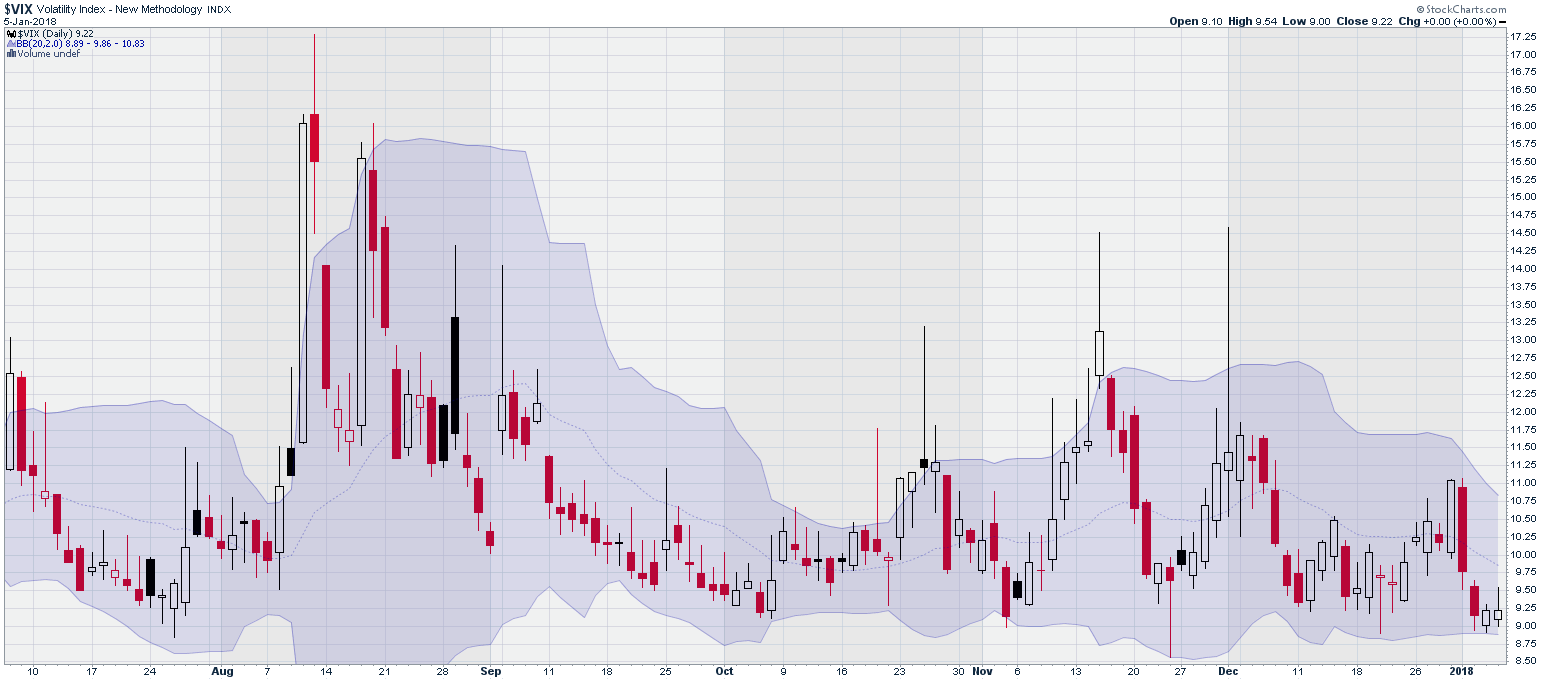
CBOE SPX Volatility Index (VIX)
Chart courtesy of StockCharts.com
Market volatility, as measured by the CBOE S&P 500 Volatility Index, (VIX), set new record lows last week, hitting levels below 9% intraday and closing as low as 9.2% Thursday and Friday.
These record lows in volatility tell us that the large institutional traders don’t see much on the horizon to worry them.
Of course, we have been seeing low levels of volatility for most of 2017. In fact, many gurus pointed to that as a precursor of doom and gloom. It does seem reasonable to expect some slowing of this bull market. In fact, I would consider that a healthy sign. But we will have to allow some time for the euphoria of the corporate tax reduction to sink in.
I found it interesting that the FOMC minutes last week showed that the committee members were increasing their GDP forecasts even before the tax bill passed. Remember all of the naysayers who said lowering corporate tax rates wouldn’t do anything for economic growth? Apparently, the economists on the FOMC haven’t drunk the political Kool-Aid.
Hard economic data continue to be moderately positive, with some measures coming in very strong, e.g., Chicago PMI at its highest level since March 2011. The corporate earnings reporting cycle has begun and the large banks are scheduled to report Friday, Jan. 12. Analysts will be watching those bank reports, and especially their forward guidance, very carefully.
Presuming most of the corporate earnings announcements continue to show positive growth and optimistic future guidance, we may safely assume a continuation of this bull market. But that statement worries me…


