The Fed won’t get to 2024 without a recession affecting policy. Key period is 2019-2020 when the stimulative effects of the tax cut wear off, while QE is just getting ramped up, with worsening financial conditions, writes Don Kaufman, co-founder of TheoTrade.
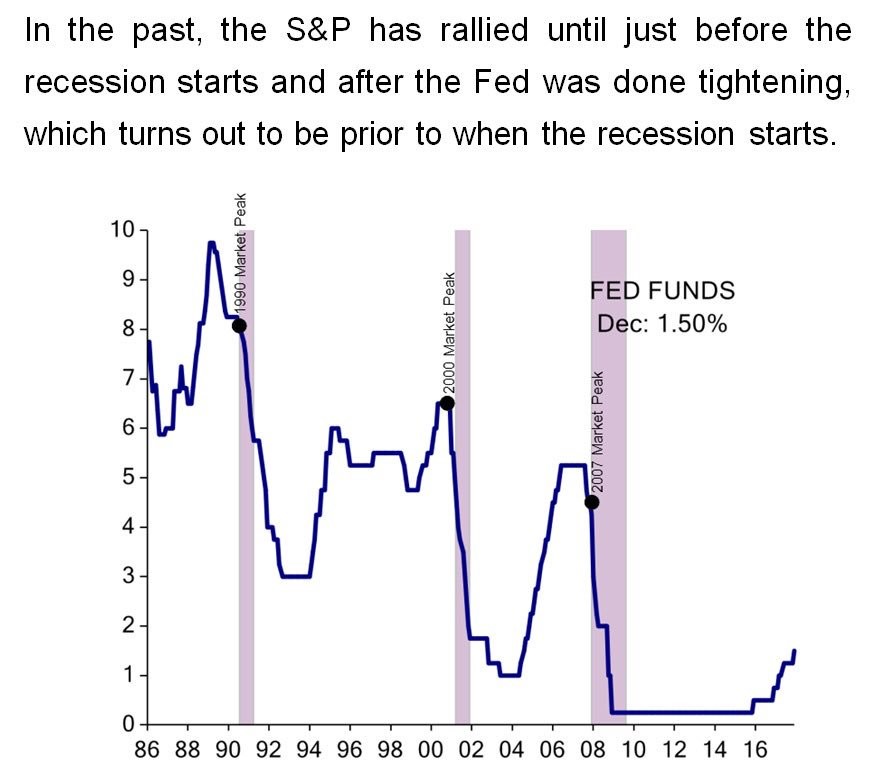
Everyone is familiar with the chart below which shows the Fed funds rate along with recessions. When the Fed raises rates too much, there’s usually a recession. There’s also a timing element to it as the cycle is usually maturing when the Fed raises rates.
By most measurements the Fed is still in an expansionary phase as inflation is below the target and the Fed funds rate is below inflation. Currently, the Fed funds rate is about 0.3% below the core CPI, meaning if inflation is stable in the next few months, the Fed funds rate will rise above it.
To me, it looks like the Fed is about 50%-70% done with its hikes. The key point is, at the end of this year, it will be mostly done.
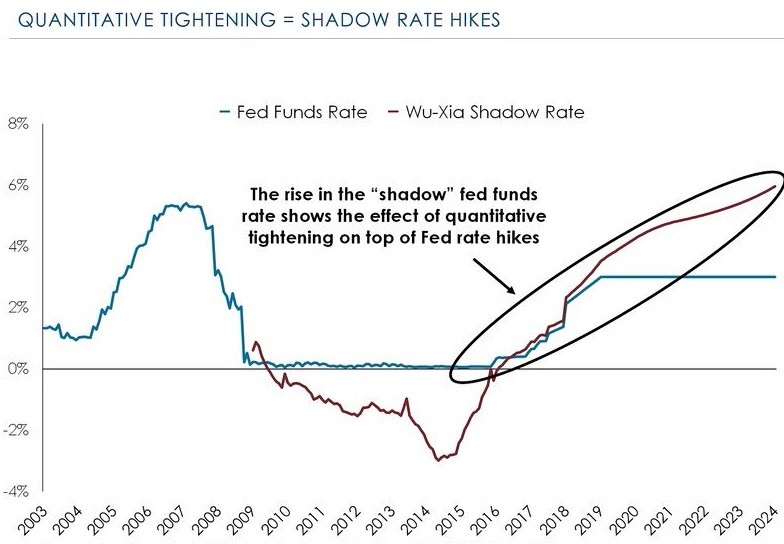
The shadow Fed funds rate was discussed in detail from 2010-2016 because it showed that QE caused the Fed funds rate to be lower than the headline number was.
It has gotten less attention in the past 18 months because now that QE is over, the shadow rate and the headline rate are identical. The point where it gets interesting is 2019 because the accelerated clip of QE tightening starts to put the shadow rate significantly above the headline rate. The chart below shows the potential result of QE tightening.
It’s obvious the Fed won’t get to 2024 without a recession affecting policy, but the key point is the 2019-2020 period because that’s when the stimulative effects of the tax cut wear off, while QE is just getting ramped up, potentially causing financial conditions to worsen.
If policy in 2020 follows this chart, I’d say that’s contractionary policy equivalent to the year 2006 or 2007 in the previous cycle.
Italian elections being priced in the eurodollar
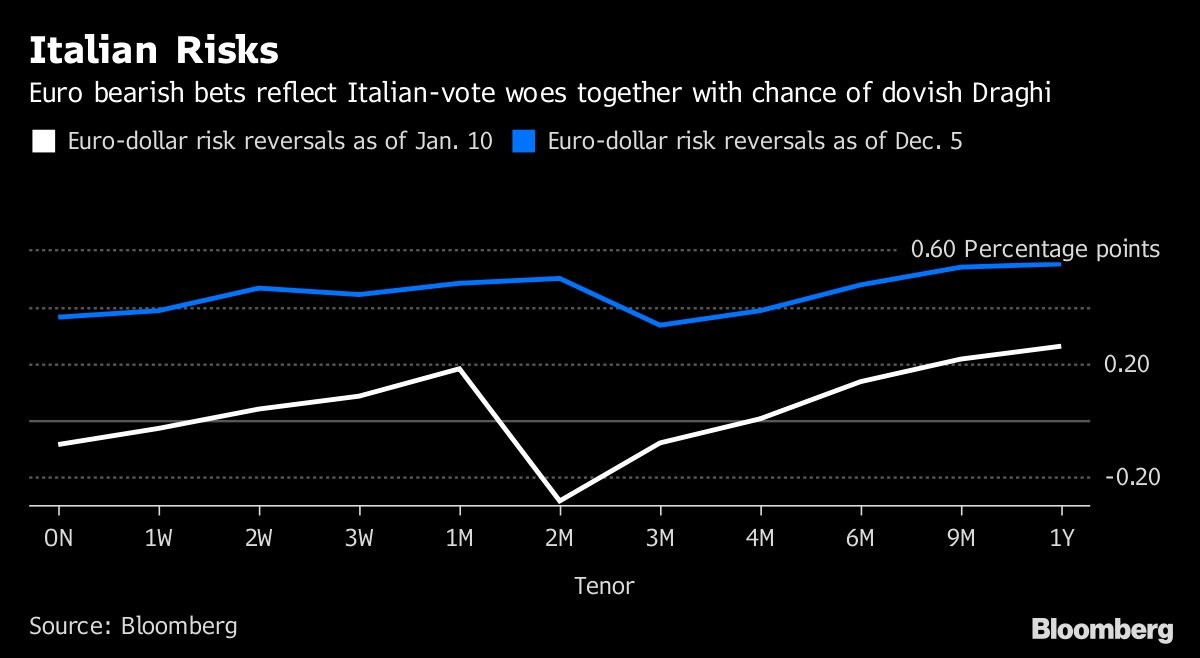
As we’ve discussed, the Italian election is one of the biggest risks of 2018 as it looks like the right wing 5 Star Movement will win. In the 4 polls this year, the 5 Star Movement has had an average of a 5.6% lead over the Democrats.
In the recent polls the Lega Nord has been losing ground and the Forza Italian party has been gaining ground. The chart below shows the eurodollar pricing in the election which is in about 2 months (March 4). The eurodollar is also pricing in the March 8 ECB meeting in which Mario Draghi will be stating the Governing Council’s latest forecasts on inflation and growth. The January ECB meeting isn’t causing any additional volatility.
German economy accelerates in Q4, coalition talks finishing up
Much like the rest of the global economy, the German economy showed strength in Q4. The quarter over quarter GDP growth was 0.5%.
GDP growth for the year was 2.2% which was the highest growth rate since 2011 when growth was 3.7%. GDP growth was 1.9% in 2016 and 1.7% in 2015 signaling there have been 2 straight years of acceleration.
I’m expecting another year of acceleration in 2018. The chart below shows the real GDP growth adjusted for the number of working days in the year. Last year’s calendar adjusted growth was also 1.9%. This is almost twice the potential of the economy according to economists.
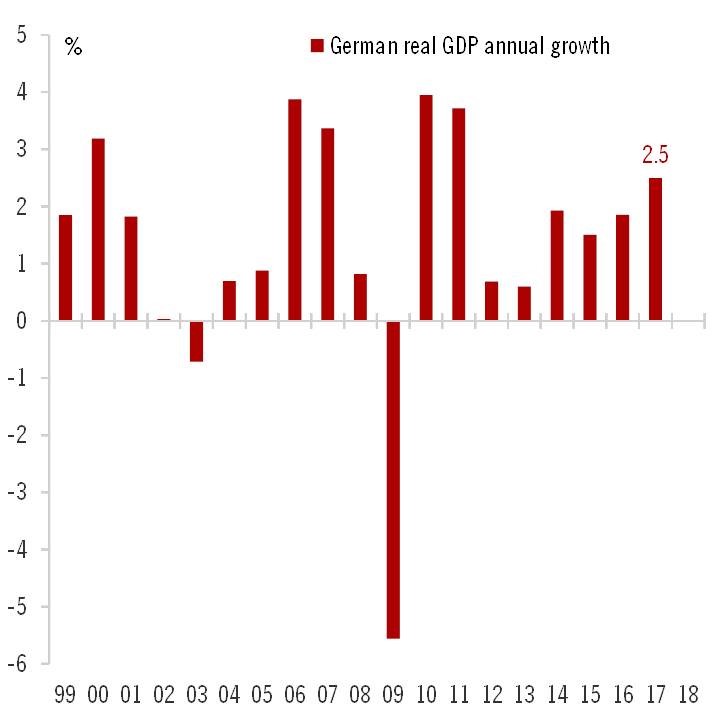
As you can see from the chart above, economic growth has been positive for 8 years. Q4 was the 14th straight quarter of positive growth.
Household spending was up 2% and government spending was up 1.4%. Gross fixed capital formation growth was 3%. Exports were up 4.7% and imports were up 5.2%. That’s a strong signal global trade growth has momentum.
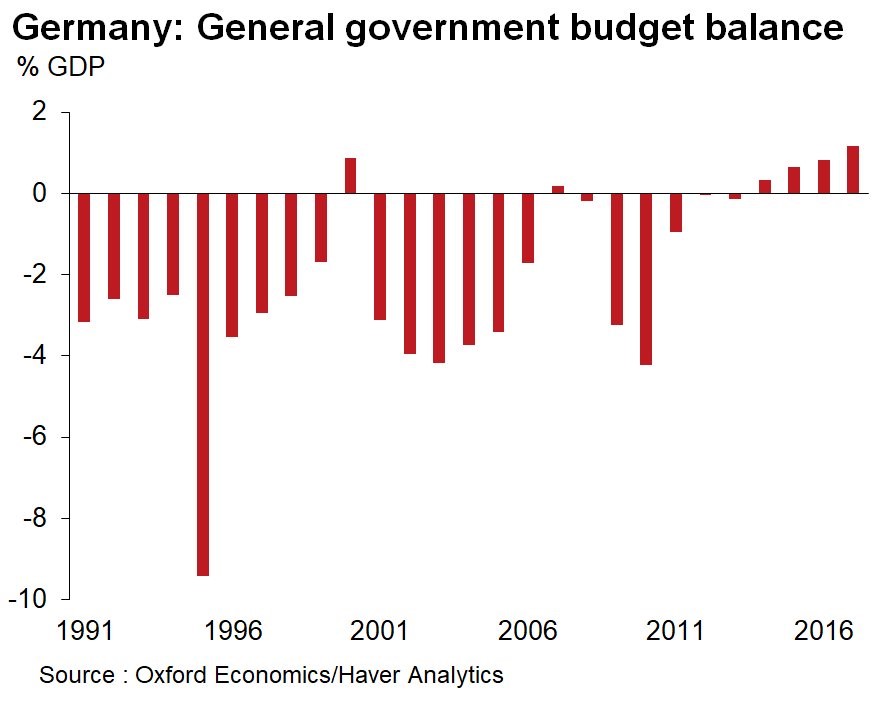
The chart below shows everything is going right in the German economy as the fiscal surplus increased to a historically high 1.2% of GDP in 2017.
Politically Germany is at an important point because Chancellor Merkel’s conservative bloc which consists of the Christian Democrats and the Christian Social Union is in exploratory coalition talks with the center left Social Democrats. If the parties come to an agreement there will be formal coalition talks after a vote on January 21 by the SPD.
If the coalition isn’t agreed upon then there will probably be another election. The Social Democrats want Merkel to back Macron, the president of France. The SPD wants a closely integrated United States of Europe by 2025. That direction makes sense for Germany because its economy has flourished since the EU was created.
The interesting point would be if the Social Democrats got their way and then the right wing parties in Italy won the March 4 election. There would be a further bifurcation in the two countries’ viewpoints on the EU as Italy would be against it and Germany would favor it.
No-deal Brexit would cost EU economy 100 billion pounds, report claims.
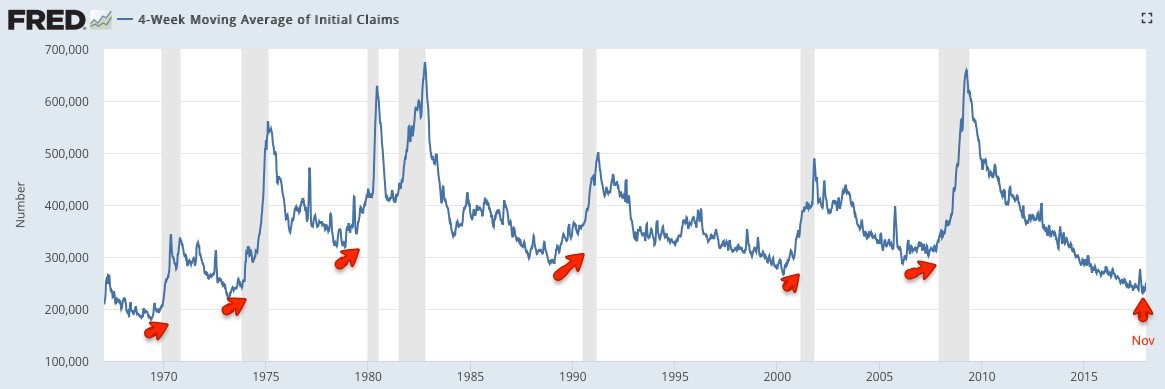
Jobless claims signal problems for the economy
The jobless claims report on Thursday showed 261,000 claims. That was 16,000 higher than expectations and 11,000 more than the previous week.
That means claims have been increasing for 4 straight weeks. Before you get too worried, keep in mind there was a snowstorm in the Northeast the previous week and there are also potential effects from the holiday season.
The unadjusted claims were up 27,170 partially because of the cold temperatures which may have hurt people’s ability to go to work. Because of this weak report, I expect the monthly jobs report also to be weak. The market won’t care if the weakness is caused by weather events. It’s possible there will be another storm before the month is over.
The chart below shows that after the 4-week moving average of jobless claims bottoms, there usually is a recession 6-18 months later. This cycle bottomed in November which was 2 months ago.
It’s way too early to claim the bottom was achieved in November. Personally, I don’t look for a bottom. I look for the claims increasing beyond a certain point, which is somewhere between 270,000 and 300,000, because the labor market is weakening, not because of one-time effects like changes in the weather or something government related. We have not seen that yet.