

Perhaps the best bet is to explore the semiconductor stocks, which remain in an uptrend but are lagging the leadership sectors such as energy while starting to show signs of strength, asserts Joe Duarte, MD. He’s traded, analyzed and written about the markets since 1990.
Global stocks are in the midst of an impressive momentum run. And as with most things in life there are two sides to the story.
Momentum runs have both a positive and a negative side, as they offer investors excellent opportunities to make big money over relatively short periods of time while often leading to their ruin once they end. Moreover, anyone who remembers the last four months of the dot-com bubble will testify to that heady feeling of portfolio invincibility of the times.
I still remember the 2000 point – 40 percent – rally in the Nasdaq Composite which started in early November 1999 and ended in March 2000. Worse are the memories of the brutal bear market that took the index down over 70 percent over the next two years.
Should I stay or should I go?
The reason I’m bringing this up is that the current market feels the same way: downright invincible. And that makes anyone like me, who’s been around a few decades hum that old song by The Clash – Should I Stay or Should I Go? In any case I hum it under my breath as I push the button to go with the flow and make another trade on the long side.
Sure, compared to the dot-com bust the current economy features some fundamental differences.
For one, the late 1990s had a totally different vibe – irrational exuberance – fueled by the sock puppet, the Dell dude and a feeling that nothing could possibly go wrong. Presently there is the perception of future positive effects for the economy resulting from the recently enacted tax cuts and an emerging set of encouraging economic data. Finally, even though interest rates are rising, as they were during the last few months of the dot-com bubble, in the present period interest rates are still close to zero for all intents and purposes.
Can algos rewrite history?
Perhaps most important is the market itself where current trading is dominated by robotic, headline reading trading algorithms—algos--instead of human traders.
So, I’m going to write this column based on the dangerous assumption that, because of the algos, this time is different. More specifically, I’m going to provide some analytical points based on the empirical assumption that because of the robots ruling the roost, little, if anything will change in this market and that the current advance is not just the new normal, but sustainable beyond anyone’s expectations.
I want to be clear: I don’t believe, in my heart of hearts, that this time is any different.
I think this momentum run will end badly, just as all the other momentum runs in history have ended badly.
But for the sake of argument, I’m just going on a mind trip. If I’m right and this market goes to Dow 30,000 in the next two months followed by a slow and steady consolidation pattern, instead of the crash of all crashes, I will be the first to admit that I got lucky.
Of course, only time will tell, so let’s have a look at what the robots are doing.
Market breadth suggests higher prices ahead
Affirming the bullish side, the most accurate indicator of the last 24 months has been the NYSE Advance Decline line (NYAD). This indicator remains in a rising channel and has robotically traded in a range defined by its upper and lower Bollinger Band for the past few months.
A tag or a rise above or below the upper band has usually led to a reversal while a tag of a fall outside the lower BB has reliably led to a move to the upside.
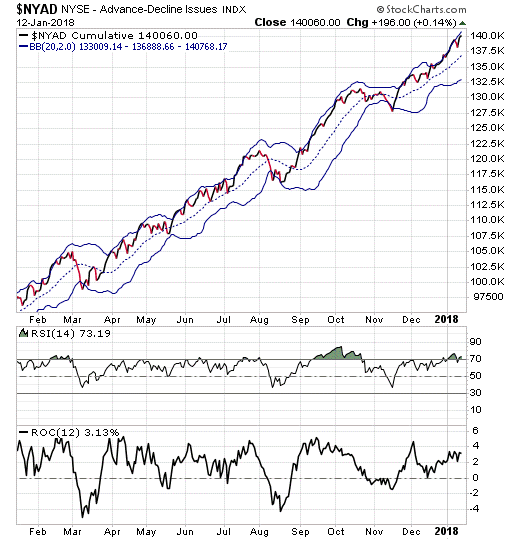
As of January 12, 2018, the NYAD made a new high and seems poised to move higher. In a world where the self-fulfilling robotic prophecy is the dominant factor, this suggests the rally has more upside room to run.
There is something here for everyone
There is no shortage of charts depicting market sectors and stocks that are impressively breaking out. In fact, of the 13 broad sectors I follow, 11 broke out last week and are in the midst of impressive advances.
Indeed, I offer one in the next few lines. At the same time, it’s important to have some perspective in this market, which is why I also have two other charts for review.
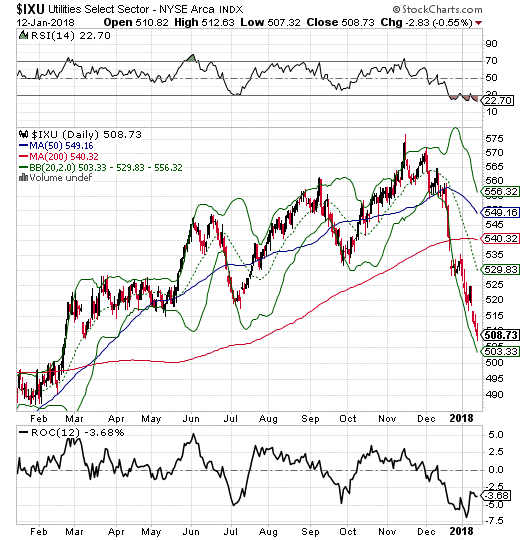
First, is the chart of the NYSE Utility Average ETF (IXU). This index is down 14 percent from its November peak. In other words, it’s now trading in the range between a correction (down 10%) and a bear market (down 20%). This sector is very oversold (see RSI), but the chart suggests it is nowhere near a bottom as the ROC, which measures momentum recently bounced.
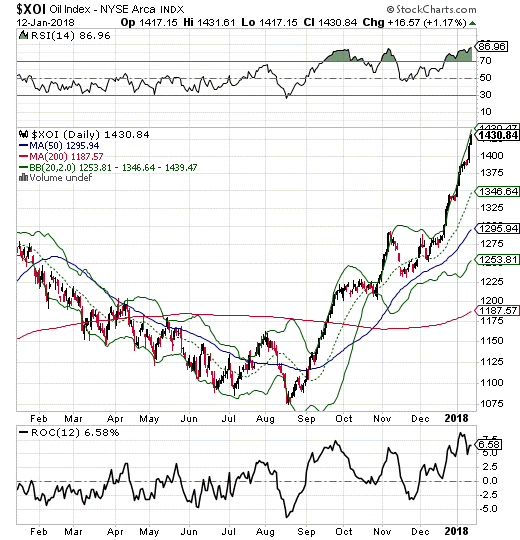
This point is best illustrated when you compare the utilities to the NYSE Arca Oil Index (XOI), which are making daily new highs. Indeed, one is the mirror index of the other. Look at RSI and ROC for XOI and you see a very overbought market with some, although receding upward momentum.
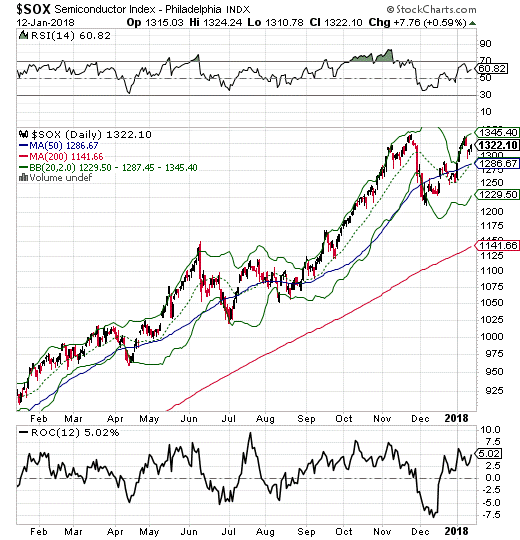
Finally, consider the PHLX Semiconductor Index (SOX) which is in an uptrend but has yet to make a new high with the market in January. In this case, RSI is nowhere near overbought while ROC is starting to strengthen.
Where should you put your money?
It’s always best to trade with the prevailing trend and this is still a bull market, albeit one in the midst of a very aggressive advance that makes me nervous.
At times such as these, it is important to remember that traditional traders often sell into strength and buy into weakness. Still buying and selling is all about timing and asset allocation. Thus, in this market, it may be too early to buy utilities, although taking some profits on energy stocks seems reasonable.
Perhaps the best bet at the moment is to explore the possibilities in the semiconductor stocks, which remain in an uptrend but are lagging the leadership sectors such as energy while starting to show signs of strength.
Joe Duarte is author of Trading Options for Dummies, now in its third edition. He writes about options and stocks at joeduarteinthemoneyoptions.com.


