

Monday is important. If the bears get another big bear trend day, that would represent follow-through selling. It would, therefore, increase the odds of a deeper, more protracted selloff, asserts Al Brooks.
Monthly S&P500 Emini futures candlestick chart:
Pullback from buy climax
The monthly S&P500 Emini futures candlestick chart had an exceptionally big bull bar last month. Since it is late in a strong bull trend, it is a buy climax. The odds favor a 1 – 3 month pullback (bull flag). This month so far is a bear inside bar.
The monthly S&P500 Emini futures candlestick chart has never had a trend this strong in the century-long history of the Dow and S&P. The measure I am using is the number of months without a pullback. February is now the 15th consecutive month with a low above the prior month’s low. This is a 16 bar bull micro channel. The next longest streak was 13 months and that was in 1995.
Markets reflect rational human behavior. Consequently, they usually can not continue to do something much longer than they have done in the past. While this buy climax might continue indefinitely, the odds are 70% that it will end within a couple of months.
Huge bar late in trend usually means exhaustive buy climax
Since January was a huge bar, the current strong reversal might not trade below its low. However, since January is probably an exhaustion bar, February will probably disappoint the bulls. This means it will probably not be another big bull bar. Additionally, it might have a bear body. If so, it will close below the open. No matter what it looks like on March 1, the odds are that March will trade below February’s low, if February did not already trade below January’s low.
That would be the first pullback in a very strong bull trend. There is a 70% chance that the bulls will buy it and the selloff will last only 1 – 3 months. Since it will be a bull flag, the odds are that the bull trend will resume up to a new high within a couple of months once the pullback ends.
Risk of bear trend is small
When a bull trend is exceptionally strong like this one, there is only a 20% chance that the 1st reversal down will result in a bear trend. Therefore, the best the bears will probably get over the next 6 months is a trading range. If the Emini enters a trading range, it then will create a credible sell setup. However, most reversals fail. Hence, the risk of a bear trend over the next 6 months is small.
I said that there is a 20% chance of a bear trend. I was trading during the 1987 Crash. It came in the absence of any news. It just happened. I mention this because there is no significant news now. This reversal is simply due to an extreme buy climax and it is therefore technical. Yet, the rally was so extreme that the reversal down could be extreme as well. That is why I think that traders have to be aware that the reversal down has a 20% chance of being much greater than what anyone on TV is saying.
Weekly S&P500 Emini futures candlestick chart:
Bear reversal after buy climax
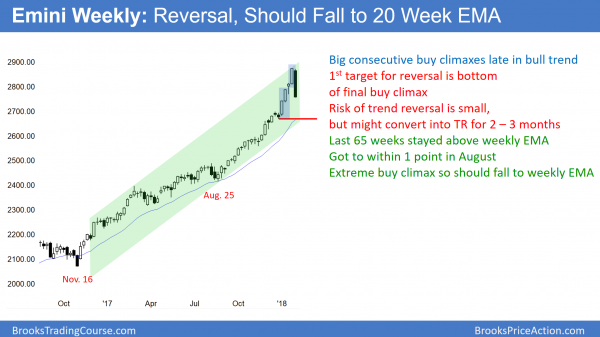
The weekly S&P500 Emini futures candlestick chart had a huge bear body last week after the previous week’s big bull bar. It closed far below the previous week’s low and should finally fall to the 20 week exponential moving average.
The weekly S&P500 Emini futures candlestick chart is in a strong bull trend. Like the monthly chart, it is the most overbought it has ever been since the start of the Dow in 1896 and the start of the S&P in 1923.
The measure I am using here is the number of weeks without touching the 20 week exponential moving average (EMA). This is now the 65th week. The longest prior streak was 62 weeks during that 1995 strong rally when the bulls had their 13 month bull micro channel.
Just like the streak on the monthly chart, this one never has to end. Since all streaks end, this one will as well. This week’s reversal is probably the start of a selloff to the 20-week EMA. The odds are increased because of the consecutive buy climaxes over the past 5 weeks. The bulls had 2 very big bars 4 and 5 weeks ago. There was a pause, and then another exceptionally big bar last week. When there are consecutive exceptionally big buy climaxes late in a bull trend, there is a 60% chance of at least a couple legs down.
20 Gap Bar buy setup
The selloff last week is probably the start of a couple of legs down to the 20 week EMA. The bulls have been so eager to buy that they have been happy to buy above the average price for more than a year. Once they get a chance to buy at the average price, they will take it.
If there is a pullback after 20 weeks above the EMA, it is a 20 Gap Bar buy setup. The odds are that the bulls can buy profitably.
That will be the case here as well. However, this buy climax is so extreme that the selloff might go 50 points below the moving average before the exhausted bulls buy again. Consequently, the pullback could last a couple of months.
Since the 20 week moving average is at 2665, that is the current target. It is also around the bottom of the buy climax that began 5 weeks ago. Because a buy climax low is a magnet, that is another reason for the Emini to pull back to that level.
However, the EMA is rising quickly. Therefore, if the pullback takes a few weeks to get there, the average might be around 2700 – 2730. In any case, a pullback to that area would be about 5%.
Trump rally beginning 5% correction over Fed fears
The correction is beginning in the absence of significant news. Yet, the pundits on TV will ignorantly decide on a reason. An obvious one is a fear of the Fed raising rates further or faster than anticipated. While that is real, the bulls are still going to buy the selloff and there will be another new high within a few months. Consequently, that reason is foolish.
TV experts believe that everything is caused by news. If they do not understand why something is happening, they will still confidently point to a news event, like a series of economic reports. They simply cannot accept that things happen that are not news related.
The unfolding selloff is happening independent of the news. It is because the market is too stretched and it will regress back to more typical behavior. This means that it is simply technical. The rally went too far, too fast.
The bulls see the recent rally as a great opportunity to take windfall profits, and they will look to buy again lower. Aggressive bears are confident of a pullback and they will sell for a trade. Once the market is no longer overbought, the bulls will buy again and there will be a new high within a few months. Technical, not news.
Daily S&P500 Emini futures candlestick chart:
Bull flag more likely than bear trend
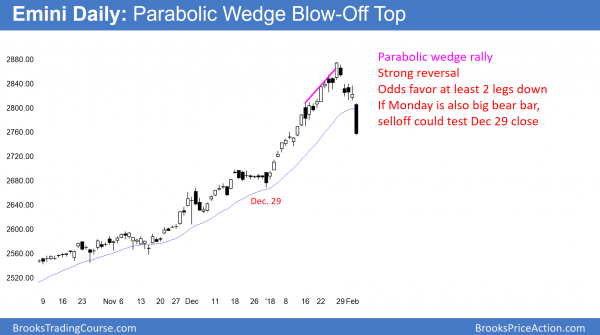
The daily S&P500 Emini futures candlestick chart had a huge bear trend day on Friday. It closed far below the 20 day exponential moving average. The breakout is strong enough to make at least a small 2nd leg down likely.
The daily S&P500 Emini futures candlestick chart sold off strongly last week, especially on Friday. In addition, the selloff was strong enough to make a second leg down likely. This is especially true since the daily chart has never been this overbought. The measure I am using is the number of days since the last small correction. The last 5% correction was 406 trading days ago.
Until Friday, there had not been a 3% correction in 458 calendar days and 309 trading days. Friday’s low was far below 2799, which means that the Emini finally had a 3% correction. The odds still favor at least a 5% correction before there is a new all-time high.
These streaks, including the weekly and monthly streaks, are likely to end soon. A 5% correction from the current high would be 2731.50. The 20 week exponential average is the minimum target for this selloff. It is now at 2665, but rising rapidly. If the selloff takes a few weeks to get there, it will be around 2700. A selloff to that level would be a little more than a 50% pullback from the January rally.
Late Momentum buyers of 5% correction could be fast
No one knows how far down a correction will go, but 5% is a reasonable minimum target. It is possible that a selloff could give back all of January’s gains. If so, the correction would be closer to 10%. That is unlikely, given how strong the bull trends are on the weekly and monthly charts.
Many of the traders who bought over the past month were afraid of missing out of a huge bull trend. These are weak bulls who bought because the momentum up is strong, not because the market is cheap. They bought to make a quick profit. Therefore, they are unwilling to risk much to make a small profit. Hence, they will be quick to get out if a correction is underway. This is because they are unrealistically terrified of a possible crash and losing everything.
Consequently, their panic selling could result in a very big, fast move down. For example, the Emini could fall 150 points in just a few days. Yet, the selloff will still be a pullback in a bull trend. Therefore, strong traders will buy it. They know the math. The odds are high that any selloff, even if it is scary, will lead to another new high within a couple of months.
The bears need follow-through selling
Monday is important. If the bears get another big bear trend day, that would represent follow-through selling. It would, therefore, increase the odds of a deeper, more protracted selloff. Look at all of the other big bear bars over the past year. All lacked follow-through selling. Each soon led to a resumption of the bull trend.
If Monday is not a big bear day, the odds of this selloff lasting only a few days go up. If Monday is a big bull day, the bulls would have a 50% chance of getting a new high before the correction reaches the 20 week moving average. At the moment, the bears have at least a 60% chance of reaching the 20 week EMA before there is another new high.
Watch Al Brooks discuss how to trade common patterns that form during the first hour in his talk at the recent TradersExpo Las Vegas here
Traders can see the end of the day bar-by-bar price action report by signing up for free at BrooksPriceAction.com.


