

Every bear breakout fails within a day or two bars (days). The pullback keeps growing higher. After about 20 bars, there is a 50% chance of a bull break and a measured move up. That would probably result in a new all-time high, asserts Al Brooks.
Monthly S&P500 Emini futures candlestick chart:
Big, but brief reversal
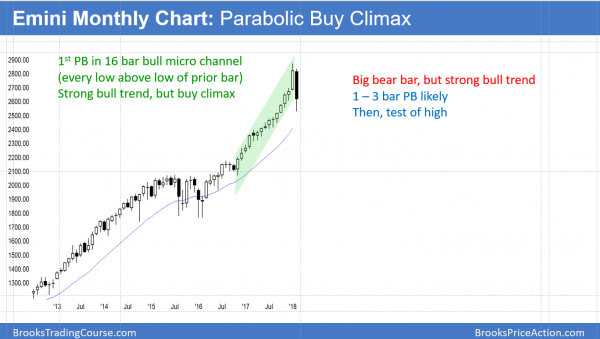
The monthly S&P 500 Emini futures candlestick chart this month traded below last month’s low. This is the 1st pullback in 16 months. The bar is currently a big bear bar, but there are 3 weeks left to the month. Hence, it could look different on February 28.
Prior to this week, the monthly S&P 500 Emini futures candlestick chart had been in a 16-month bull micro channel. This means that every month had a low above the low of the previous month. This has never happened in the 122-year history of the Dow Jones Industrial Average (DJI) or the 96-year history of the S&P 500 Index (SPX). It was unsustainable and therefore climactic.
Yet, it is a sign of a very strong bull trend. The bulls have been so aggressive and confident that they were buying above the low of the prior month for more than a year. Once they believe that the bears will be unable to reverse the trend, they will become eager to finally be able to buy this pullback.
The first reversal down in a bull micro channel usually lasts 1 – 3 bars (here, months). Then, the bull trend resumes. However, when a micro channel lasts more than 10 bars, it is extreme. There is an increased risk that the pullback could be deep and last longer than expected. For example, it might retrace more than 50% of the height of the micro channel and last 5 or more bars (months).
Buy The Close Bull Trend
In addition to the rally being a 16-month bull micro channel, it was reasonable for the bulls to buy the close of every big bull trend bar. This is a Buy The Close Bull Trend. Since January was huge, it was climactic.
Buying its close was reasonable only if a trader was willing to use a wide stop and scale in lower. For example, if the selloff lasts 6 months, a Buy The Close bull might buy more above a strong bull bar. There would be an 80% chance of a test back up to the highest close (the January close). This would allow the trader to exit breakeven on his final Buy The Close entry and with a profit on his lower entry.
Once there is a rally, the bears will try to form a double top with the January high. They know that the bulls are disappointed by the strength of the selloff. They expect the bulls to take profits at the old high instead of buying high and expecting a breakout.
This month’s strong selloff results in a trading range mentality for at least 5 – 10 bars. Therefore, a break to a new all-time high will probably test back down within a few months instead of continuing the bull trend.
Only 20% chance of bear trend without at least a micro double top
Traders should know that there is only a 20% chance of a strong bull trend reversing into a bear trend without at least first forming a micro double top. This means that the bears will need at least a test of the old high before they have more than a 20% chance of taking control.
I am talking about the monthly chart. They clearly are in control on the daily chart. But since the monthly chart should resume up within 1 – 3 months, the sharp selloff on the daily chart will be brief.
I have said many times that the correction would be at least 5% and probably closer to 10%. It hit 10% this week. I also said that it could be 20%, but that the bull trend is so strong that the bulls will buy even a 20% selloff.
The selloff is technical, due to going too far, too fast
I always enjoy it when the market confirms that its past behavior predicts its future behavior. Since market movement (price action) is a reflection of rational human behavior, tendencies repeat. It is genetically based, and it is the foundation of technical analysis.
I wrote repeatedly in January that the stock market had never been this overbought on the daily, weekly, and monthly charts in its 100 year history. The January 27 title of the section on the monthly chart was, “Blow-off top.” In that report, I wrote, “In addition, since it is much longer than any prior streak, the odds are that the weekly chart will begin to turn down within the next few weeks.” It began during the following week.
The title of my January 20 weekend update was, “Emini forming blow-off top leading to giving back 2018 gains.” In that report, I said that the Emini would probably pull back 5 – 10%. In addition, I said that it would probably erase all of January’s gains. It did over the past week.
In my February 3 report, I had a section called, “Trump rally beginning 5% correction over Fed fears.” This was based on the big January bull bar on the monthly chart and the consecutive buy climaxes over the prior 4 weeks on the weekly chart. I wrote this based on over 30 years of studying charts for 10 or more hours a day and 10,000 hours of back-testing. I was confident of the math.
In that same report, I had a section titled, “Late Momentum buyers so 5% correction could be fast.” I wrote, “Consequently, their panic selling could result in a very big, fast move down. For example, the Emini could fall 150 points in just a few days.” It fell 200 points on last Friday and this Monday, and the 2 week selloff so far has been more than 300 points.
Bear trend or bear trap?
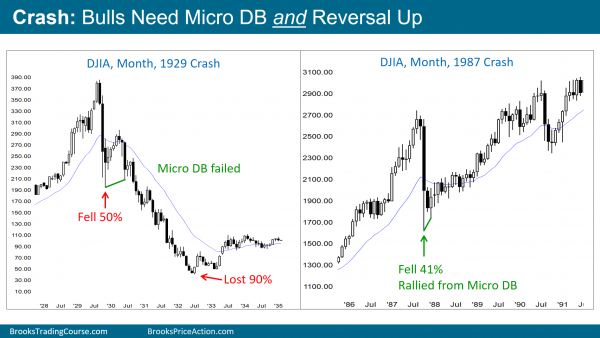
The monthly chart of the Dow Jones Industrial Average in 1929 shows a selloff that led to a huge bear trend. However, as severe as the 1987 Crash was, it was a bear trap. The market had an endless pullback that led to a bull trend.
Compare the DJIA monthly charts of 1929 and 1987 Crashes. They show extremely opposite outcomes. The 1929 Crash formed a double bottom that failed. It was a Spike and Channel bear trend that erased almost 90% of the market’s value. The 1987 Crash formed a micro double bottom that led to a tight bull channel. The bears were trapped into shorts in a selloff that had reversed into a bull trend.
The current selloff is small compared to the initial drop in 1929 and in 1987. However, the shape is similar. Will it be a spike that leads to a bear channel, or will it be a bear trap in a bull trend?
Since the monthly chart was in a micro channel for 16 months, the odds of a bear trend without at least a lower high or a double top are only 20%. However, it is too early to know the path back up to the high. The Emini could easily fall another 5- 10% before the bull trend resumes. Yet, the odds are high that this selloff will end up as a pullback in a bull trend on the monthly chart.
Weekly S&P500 Emini futures candlestick chart:
Sharp selloff to the 20 week EMA
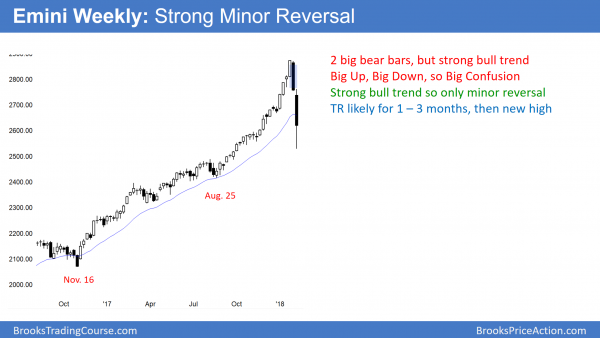
The weekly S&P 500 Emini futures candlestick chart finally sold off to the 20-week exponential moving average (EMA) after not touching it for 65 weeks. The two big bear bars created a Big Up, Big Down pattern with the January rally. That creates confusion and usually leads to a trading range.
The weekly S&P 500 Emini futures candlestick chart relieved its extreme buy climax with a strong selloff to the 20-week EMA. Each of the past 65 weeks has a gap between its low and the 20 week EMA. August got to within 2 ticks, but did not touch. This is the longest streak without touching the 20-week EMA in the 100 year history of the stock market.
The consecutive buy climaxes over the past 4 weeks made a correction likely last week. A reasonable minimum goal is TBTL (ten bars, two legs). Hence, traders should expect a trading range lasting 2 – 3 months. This is especially true after the unusually big and fast 2-week selloff.
While the selloff is just a bull flag on the monthly chart, it will probably form a trading range on the weekly chart. A bull flag on the monthly chart means that the trading range on the weekly chart will probably have an upside breakout.
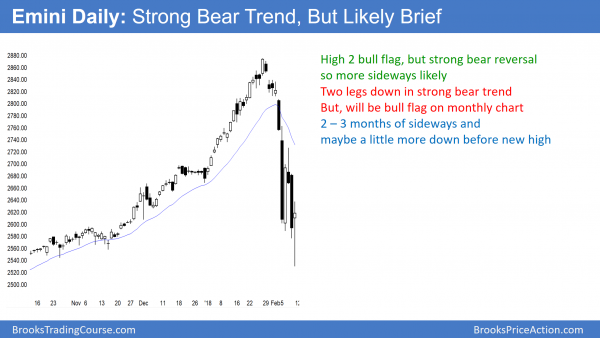
Daily S&P 500 E mini futures candlestick chart:
Tradable bottom in 1 – 3 month developing trading range
The daily S&P 500 Emini futures candlestick chart had 2 huge legs down in a strong bull trend. The size of Tuesday’s and Friday’s rallies reduce the chances of a protracted and deep bear trend.
The daily S&P 500 Emini futures candlestick chart fell 10% in two weeks and is Always In Short. This is a bear trend on the daily chart, even though the media generally refers to a 10% selloff as a correction. They reserve the term “bear trend” for a selloff of at least 20%. The selloff will probably lead to a trading range on the weekly chart and a bull flag on the monthly chart. It ended the longest streak in the history of the stock market without either a 3% or a 5% correction.
There have been two huge legs down, and each had no immediate follow-through selling. These are consecutive sell climaxes. Consecutive sell climaxes typically evolve into a trading range. Once in a trading range, the bulls will create a major trend reversal. Alternatively, there will be a third brief leg down, which would create a wedge bottom.
The Tuesday and Friday bull reversals were extremely strong. In addition, the monthly chart is very bullish. Consequently, there is a 50% chance that Friday will remain the low.
Finally, there is currently a 30% chance that the bull trend will resume this week without first entering a trading range. If so, the reversal up will probably be an Endless Pullback from the 2 week selloff. That means it would be a tight bull channel that looks like a bear flag. Yet, every bear breakout fails within a day or two bars (days). The pullback keeps growing higher. After about 20 bars, there is a 50% chance of a bull break and a measured move up. That would probably result in a new all time high.
Emini tradable bottom in developing 2 to 3 month trading range
Tuesday’s and Friday’s reversals were very strong after big sell climaxes. The monthly chart is in a bull trend. A trading range is likely for 1 – 2 months. Since the odds are against the bull trend resuming and against much lower prices, that leaves traders with a trading range. Friday was a High 2 buy signal (Tuesday was the High 1). It is a reasonable candidate for the end of the 1st leg down.
A trading range has legs up and down. The odds are that next week will be sideways to up and begin a bull leg in the trading range. The 1st target is Wednesday’s high and a 50% retracement, which is about 100 points up. The bears will try for a double top.
The rally will probably go above Wednesday’s high. Yet, this is a trading range. That means that the rally will lead to another leg down. It is too early to know how many legs up and down will form. At a minimum, there will probably be both a double top and a double bottom within a month. That is what typically happens after a strong selloff. Confusion. Which means a trading range with both some kind of double bottom and double top.
Watch Al Brooks discuss how to trade common patterns that form during the first hour in his talk at the recent TradersExpo Las Vegas here
Traders can see the end of the day bar-by-bar price action report by signing up for free at BrooksPriceAction.com.


