

There’s a 30% chance that the strong trend resumption will continue above January’s high. February would be an outside up month. An outside month is often followed by an inside month. In early March, traders might sell just below February’s high, asserts Al Brooks.
Monthly S&P500 Emini futures candlestick chart:
First pullback after 16 bar bull micro channel
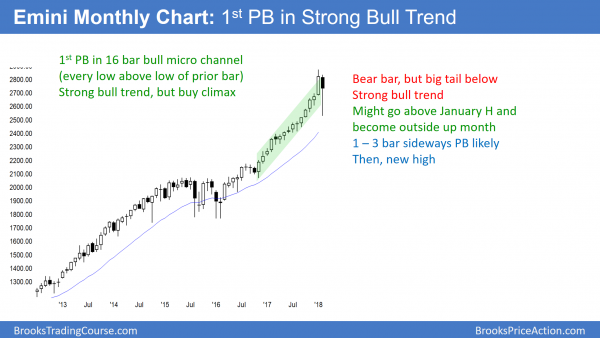
The monthly S&P500 Emini futures candlestick chart had its 1st pullback in 16 bars. The bulls bought below January’s low. The month so far has a big tail below, which indicates strong buying.
The monthly S&P500 Emini futures candlestick chart finally had a pullback after a 16 bar bull micro channel. This means that every low was above the low of the prior month. The bulls were so aggressive that they were not waiting for pullbacks to buy. They were buying at the market. The odds were high that they would be happy to finally get a chance to buy below the prior month’s low. The got their chance over the past two weeks.
I have been writing for several months that the first pullback would probably last 1 – 3 months. That is still true. Hence, the Emini could go sideways for a few months before making a new all-time high.
It is important to realize that the odds of a bear trend at this point are only 20%. The bears usually need at least a micro double top. This means that they need at least a test of the all-time high before they will have more than a 20% chance of a bear trend.
Even if they get a micro double top, the odds might then only be 30%. Traders will continue to look to buy until there is a strong reversal down on the monthly chart. That means that the downside risk over the next several months is small.
Outside up month?
February reversed up strongly from below January’s low. In addition, the bull trend on the monthly chart is exceptionally strong. While the January high is still far above the current price, there are two weeks left in the month. There is a 30% chance that the strong trend resumption will continue for the remainder of the month to above January’s high. February would then be an outside up month in a strong bull trend. This would simply be another sign of how strong the trend is.
Yet, an outside month is often followed by an inside month. Consequently, in early March, traders might sell just below February’s high. While this would be a pause in the bull trend, it would not be particularly significant. The bull trend on the monthly chart is strong.
Weekly S&P500 Emini futures candlestick chart:
20 Gap Bar Buy Setup in strong bull trend
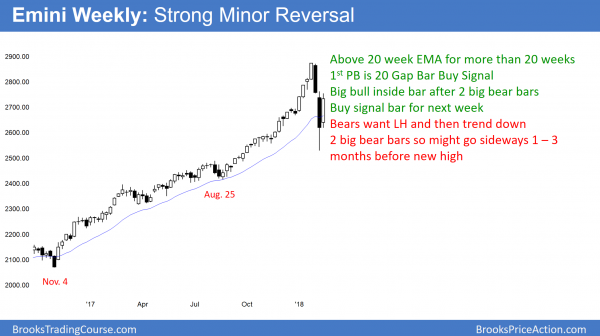
The weekly S&P500 Emini futures candlestick chart was above its 20-week exponential moving average (EMA) for 65 weeks. Its sold off strongly to the average last week and the bulls bought aggressively this week. This week is a bull inside bar and therefore a buy signal bar for next week.
The weekly S&P500 Emini futures candlestick chart had not touched its 20 week EMA in 65 weeks. The bulls were so aggressive that they kept buying above the average price for over a year. This was an extreme buy climax, and it led to an extreme reversal. Yet, the bull trend is still intact. The bulls strongly bought the selloff this week.
Because the two week selloff was strong, there might be a second leg sideways to down over the next few weeks. Yet, this week’s reversal up erased much of the damage caused by the selloff. Therefore, the best the bears can probably get is a 1 – 3 month trading range.
The odds are that last week’s low will be the bottom. If the bears break below, the bear breakout will probably fail. This would then create a two-legged pullback in a strong bull trend. Traders would look to buy a reversal up, which would be a High 2 bull flag.
Buy signal on the weekly chart
Whenever a market stays above its average price for 20 or more weeks, there is a gap between the low of every bar and the moving average. Since the bulls are able to put all of those bars above the average price, the bull trend is strong. Traders, therefore, are eager to buy a pullback to the average price.
A test of the average is a 20 Gap Bar buy setup. Last week closed on its high and was a big bull inside bar. In addition, it reversed up strongly from below the 20-week EMA. The buy setup is strong and this week is a strong buy signal bar. The odds are that next week will trade above this week’s high. That would trigger the buy signal.
There are several reasonable outcomes. The bulls might be so strong that the rally will race up to a new all-time high. February could even become an outside up month. Alternatively, the buy signal does not trigger and the week becomes a 2nd consecutive inside week. Even worse for the bulls is the small chance that the Emini simply collapses below this week’s low.
The most likely outcome is that next week triggers the buy, but next week is a disappointing entry bar. For example, it could have a big tail on top, or a small bull body, or even a bear body. Since the two week selloff was extreme, the Emini will probably go sideways around the middle of the selloff. Therefore, a trading range for a week or two is likely.
Daily S&P500 Emini futures candlestick chart:
Strong reversal up from High 2 bull flag after consecutive sell climaxes
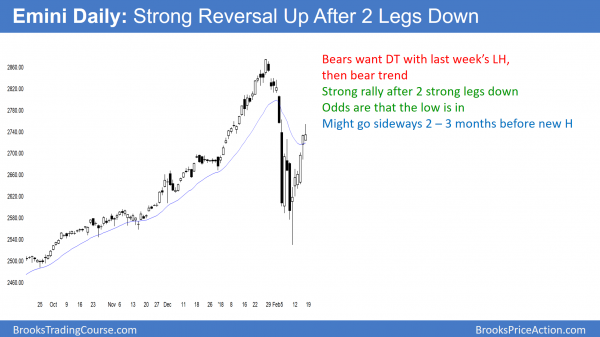
The daily S&P500 Emini futures candlestick chart had two huge sell climaxes and two very strong reversals up. This week rallied strongly up to above last week’s lower high.
The daily S&P500 Emini futures candlestick chart had a 2 week sell climax and a 10% correction. The 2 reversals up were exceptionally strong. The odds are that the bull trend is resuming. Yet, it is now in a resistance area. Last week’s lower high and the 20 day EMA are resistance.
January’s midpoint around 2780 is also resistance. January was a strong bull trend, and therefore it was reasonable for traders to buy. However, it was not prudent, given how I said that a 5 – 10% correction was likely to begin within a few weeks. When there is a reasonable buy, traders are usually able to avoid a loss.
xperienced traders often scale in during a selloff and can make a profit on a pullback back up. The average trader simply buys and holds.
Once he sees a huge selloff, he decides that he probably bought too high. He is therefore hopeful for a rally that will allow him to exit without a loss. Since the average trader who bought in January theoretically bought at the average price in January, that trader will look to sell part or all of his position on a rally to that price. The rally will have made him whole, and he will be relieved to step aside and wait to see what the market does next.
Big Up, Big Down, Big Up creates big confusion
The January rally was strong, as were the February collapse and this week’s reversal back up. Multiple big reversals indicate that traders are unwilling to hold positions for an extended time. This, therefore, is a sign of a developing trading range.
While the reversal up is probably the end of the bear trend, that does not mean that it is the start of a bull trend. What about a trading range? The odds are that the correction is over and that the bull trend will see a new high within 1 – 3 months. However, the big reversals increase the odds or more sideways trading first. The Emini is now in an area that the bears thought was a great price to sell aggressively. They might sell again in the 2750 area.
Yet, the reversal up from two legs down make it likely that the Emini will work its way up to a new high. If the bears do get a strong selloff within the next month, they will likely be overwhelmed by buyers around or above last week’s low. Therefore, the best the bears will probably get on the daily chart is a 2 – 3 month trading range. If they succeed, the odds are that the bulls will create a major trend reversal that will then lead to a new high.
Double top bear flag
The bears want a double top with last week’s lower high at around 2726. They then want a break below last week’s low, which is the neck line of the double top.
In general, the bears would have a 40% chance of a measured move down when they have a double top bear flag in a bear trend. Here, the probability on the daily chart is 30% (and only 20% on the monthly chart). This is because the reversal up was so strong and the weekly and monthly charts are in strong bull trends.
onsequently, if the bears get a strong selloff next week, it will more likely be a buying opportunity.
The rally last week was strong enough so that at least one more leg up is likely after the first reversal down. However, if there is a strong selloff in the next couple of weeks, and then a rally above this week's high, the bears would try to create a wedge lower high major trend reversal. As with all major trend reversals, there would then be a 40% chance of a swing down to below the February low. Moreover, the selloff could easily continue down to 20%. There are several conditions in this paragraph. That means the probability of all of them is happening is small. Yet, it goes up after each one materializes.
Watch Al Brooks discuss how to trade common patterns that form during the first hour in his talk at the recent TradersExpo Las Vegas here
Traders can see the end of the day bar-by-bar price action report by signing up for free at BrooksPriceAction.com.


