

After a huge Up/Down move, odds favor a sideways market for at least another month. Traders will probably buy around the February low and sell around the January high. Most will buy low, sell high, and take quick profits, asserts Al Brooks.
Monthly S&P500 Emini futures candlestick chart:
February is huge bear doji candle stick
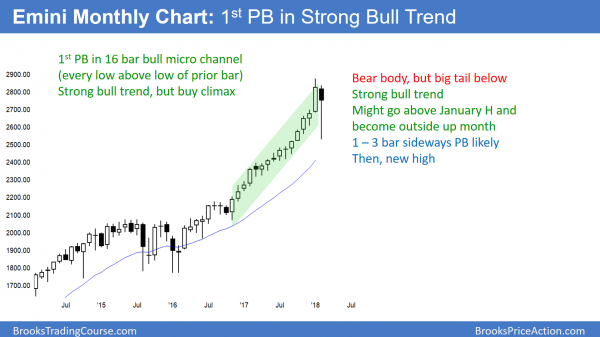
February on the monthly S&P 500 Emini futures candlestick chart is a huge bear doji in a strong bull trend.
The monthly S&P500 Emini futures candlestick chart traded from just below January’s high to far below its low. It then reversed up strongly, but is currently still below the open of the month. February is a big bear doji month. The Emini is currently trading in the top half of February’s range. There are still 3 trading days left, and the candle stick pattern could be very different once the bar closes at the end of the month on Wednesday.
Since February is a huge bar and the Emini is in the middle with only 3 days left, the odds are against the month closing above January’s high or on its low on Wednesday. More likely, it will close somewhere in the upper half. The exact middle is 2702.25. This is very close to the 2700 Big Round Number, which is also a magnet. However, both are about 50 points below Friday’s close and Friday broke above a 3-day bull flag. The momentum favors higher prices next week.
Another magnet is January’s low of 2681.75, but that target is probably too far below Friday’s close. January’s low is important because every low for the past 14 months has been above the low of the prior month. January’s low is the first to be violated. February is a break below the 15-month bull micro channel. The bears want a close below the breakout point, which is January’s low. Traders would see this as a sign of strength on the part of the bears. The bulls always want the opposite. They want the bear breakout to fail and for the bull trend to resume quickly. They are currently winning.
15 bar bull micro channel represents relentless buying by strong bulls
Most traders will not attach too much meaning to a close a little or above last month’s low. Other factors are more important. The single most important is that a 15 bar bull micro channel means that the bulls have been aggressively buying for over a year. As strong as the February selloff was, the rally back up represents very confident bulls. They bought a collapse on the daily chart.
This is because they understand the math. There is only a 20% chance of a strong bull trend reversing into a bear trend without first forming at least a micro double top. Consequently, the probability is that the bulls who took the opportunity to buy the brief discount will make money.
15 bar bull micro channel is also a buy climax
The monthly charts of the S&P and Dow have never had a 15 bar bull micro channel in their 100-year histories. The micro channel was therefore unsustainable and climactic. A buy climax does not typically reverse into a bear trend. It usually leads to a pullback. This is a bull flag, which means a pause in the trend. The odds are that the bull trend will soon begin again.
When a micro channel lasts more than 5 – 10 bars, the odds are that the 1st pullback will last only 1 – 3 bars. Then, the rally usually resumes and tests the old high. This is what is likely here. That means that the monthly chart will probably go sideways for 1 – 3 months and then test the old high. At that point, if the bears get another reversal down, there would be a micro double top. If that second reversal is strong, the bears could have up to a 50% chance of a 5 – 10 bar (month) two legged sideways to down pullback. At the moment, this is unlikely.
Inside bars often follow huge bars, creating Hig 1 bull flag
February traded from near January’s high to far below January’s low. It then reversed up strongly to near the open of the month. If it closes in its middle 3rd, there is a 50% chance that March will not go above February’s high or below its low. March would then be an inside month. It would then be a High 1 buy signal bar. This means it is the first pullback in the current leg up in a bull trend. Bulls will buy above its high.
If March is an inside bar closing on its high, it would be a reasonable buy signal bar. In addition, there probably would be buyers below March’s low.
If it closes on its low, it would be a sell signal bar. There would probably be sellers above its high. However, since the bull trend is so strong, the downside is small without the monthly chart first going sideways for at least several months.
The huge down move in February generated a lot of confusion. Confusion creates uncertainty. When traders are uncertain, they tend to buy low, sell high, and take quick profits. The result is that a breakout above or below March might not go far.
Outside up month?
There are 3 days left to the month. January’s high is 130 points above Friday’s close. Since the reversal up has been strong, there is a 20% chance that February might trade back above January’s high. It would then be an outside up month. At a minimum, the bulls would like the month to close above its open so that it would have a bull body. That is still 80 points above Friday’s close and it is probably too far to reach in 3 days.
Weekly S&P500 Emini futures candlestick chart:
Emini has ii Breakout Mode pattern on weekly chart after FOMC
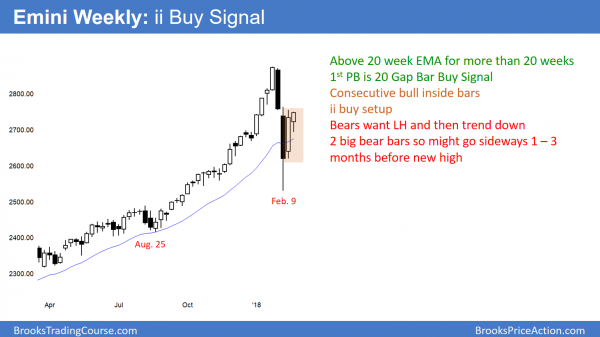
This week on the weekly S&P500 Emini futures candlestick chart has a high below last week’s high and a low above last week’s low. It is an inside bar. Furthermore, last week was also an inside bar. Consecutive inside bars is an ii Breakout Mode setup.
The weekly S&P 500 Emini futures candlestick chart has an ii Breakout Mode setup. The bar two weeks ago closed on its high and had a big bull body. It was a buy signal bar for the first pullback to the 20-week EMA in over a year. It is a 20 Gap Bar buy setup. The bulls failed to trigger the buy this week.
This week was another inside bar closing on it high. This is a buy signal for next week. The odds are that Monday will trade above this week’s high and trigger the buy signal.
Since the ii is a Breakout Mode pattern, it is also a sell setup. However, the 2 bull bodies closing on their highs and the strong bull trend make a big bear breakout unlikely.
Two or more big reversals make a trading range likely
Finally, the Big Up in January and the Big Down in February create Big Confusion. That usually leads to a trading range. A trading range is more of a limit order market. Rather than buying on a stop above the high of the previous bar, there might be many traders looking to sell above with limit orders and scale in higher. In addition, there are certainly more traders looking to buy below this week’s low than there are traders looking to sell with a stop below the low.
Any pause in a strong bull trend is a bull flag. Therefore, the odds favor a bull breakout above the ii pattern. Yet, the Big Up, Big Down pattern is important.
onsequently, there is a 50% chance that a rally above the ii will not break strongly above the January all-time high without first going sideways for a few weeks.
However, the odds favor at least slightly higher prices next week. Furthermore, March and April are the most bullish consecutive months of the year. Therefore, there is a seasonal upside bias.
Will there be a strong breakout up or down within a few weeks?
The bull trend is strong. Therefore, a downside breakout below the ii pattern would probably not get far. Since the odds are against a big move up above the old high or a big move down, then a trading range is likely. If the bears get a strong reversal down from above the ii, then the trading range could last at least a month.
However, this is not likely. More likely, the weekly chart will trade up for at least a week. The rally might get back to the old high within a few weeks. But, it will probably stall there for at least a few weeks because the February selloff was so strong.
What happens if instead there is a strong bull breakout? The odds are that traders will sell around the January high. What if there is a strong bear breakout? Most trading range breakouts fail, no matter how strong they are. Consequently, the odds of a sustained breakout up or down within the next few weeks are small.
Daily S&P500 Emini futures candlestick chart:
Bull flag is more likely than bear trend resumption
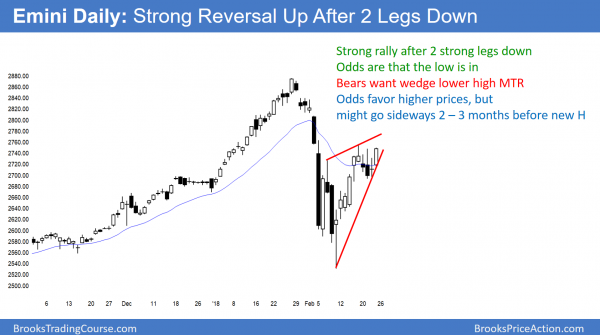
The daily S&P500 Emini futures candlestick chart reversed up sharply after 2 strong legs down. Friday was a breakout about a week long High 2 bull flag.
The daily S&P500 Emini futures candlestick chart had a big bull trend day on Friday. It was therefore a breakout above a 3 day ioi pattern after a 6 day bull trend. The bulls need follow-through buying next week to confirm that the 5-day tight trading range is ending and the bull trend is resuming.
The bears failed to create a double top bear flag with the February 7 lower high. Since the odds favor a rally next week to above last week’s high, the bears will try to make the breakout fail. If they are successful, they will have a wedge lower high major trend reversal sell setup. However, the rally has been so strong that the bears would have only a 30% chance of a selloff down to the February low from that setup. More likely, if they get a selloff, it will lead to a continuation of the February trading range and not a bear trend.
Bull flag, but within a trading range
Last week was a bull flag. A bull flag means that the odds favor a bull breakout. However, the huge reversal down in February makes a trading range over the next month more likely that an uninterrupted rally far above the old high.
A bull breakout above the week-long bull flag will be the third rally since the February 6 low. If the bears can reverse the Emini down after a brief leg up over the next 2 weeks, they will have a wedge lower high major trend reversal. More likely, the rally will have at least a couple more small legs up.
A major trend reversal only has a 40% chance of actually leading to an opposite trend. Therefore a reversal down from the wedge rally will probably have a couple legs, last a couple of weeks, and form a higher low. It would be a bear leg in a developing trading range.
Signs of a trend
Beginning traders tend to look at only the most recent leg. The bars to the left of the current leg are also important. As strong as the reversal up over the past 2 weeks has been, it is still a bull leg in a trading range. As long as any selloff reverses up from around the February low or reverses down from around the January high, the trading range is still intact. Traders need to see a series of strong trend bars up or down before they believe a trend is underway. Furthermore, they need a strong breakout up or down with good follow-through. This will eventually happen.
However, after a huge Up/Down move, the odds favor a sideways market for at least another month. Traders will probably buy around the February low and sell around the January high. They are not confident that a breakout will be successful, and therefore most will buy low, sell high, and take quick profits.
This is what typically happens when there are sharp reversals down and up. After 20 or more bars of not seeing a huge move against what they think is the correct direction, they will begin to swing trade again. Traders need more time, and therefore the trading range that began in early February might last at least a few more weeks.
Watch Al Brooks discuss how to trade common patterns that form during the first hour in his talk at the recent TradersExpo Las Vegas here
Traders can see the end of the day bar-by-bar price action report by signing up for free at BrooksPriceAction.com.


