

Don’t analyze situations on the fly and make trades off quick judgments. Otherwise, you’ll sell every time the financial media writes a scary story, says Don Kaufman, co-founder of TheoTrade.
The labor market is more complex than some people give it credit for. Calculating the wage growth rate leads to varying results.
The Fed is essentially like a helicopter pilot wearing blurry glasses. It can’t even be sure what the wage growth for last year was let alone make forecasts which are accurate. This is not knocking the Fed at all. The regional Fed economic data is great. It’s a complicated task at hand.
The reason why I’m making this point is that the Brookings Institute has real wage growth data which differs from what I’ve seen. I think it’s important to show the information even though I disagree with it. Yes, it’s possible to disagree with statistics.
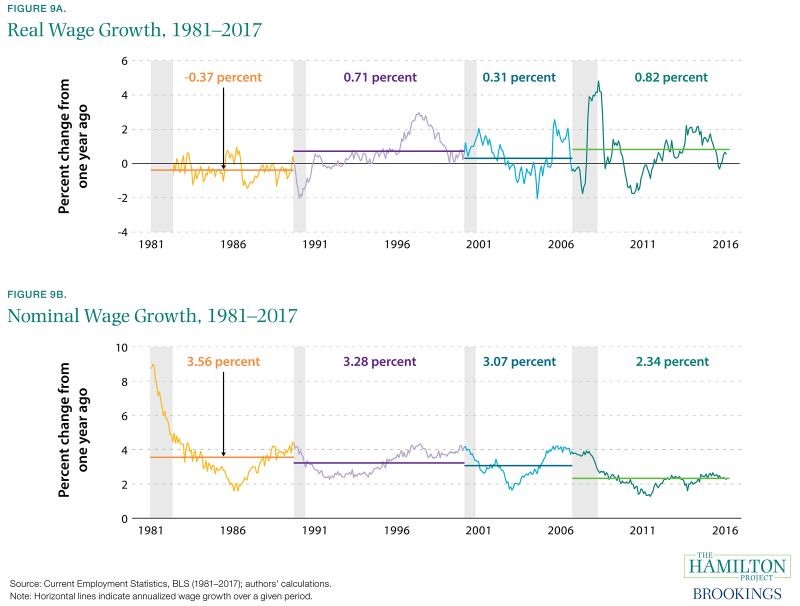
The charts below are from the Brookings Institute. They look at year over year average hourly earnings growth for production and non-supervisory workers. The bottom one shows the average nominal wage growth in this business cycle is the lowest of the previous four. However, the chart on top shows that real wage growth is the highest in this cycle.
One key point I see in the chart is that the wage growth hasn’t reached the peaks seen in the prior two cycles. Judging by how low the wage growth has been recently, this chart agrees with the thesis that there’s still room to run in this cycle.
Labor participation rate still low
This article shows the thesis that the business cycle isn’t near its end. Whether that means we’re near the end of the middle of the cycle or at the beginning of the end is semantics. A recession can happy at any moment, but the chance of it being caused by a full labor market is low in 2018. Remember, when there’s very high wage growth, the Fed gets hawkish, causing a recession. For the wage growth information, I prefer the Employment Cost Index and the Atlanta Fed model to that Brookings data.
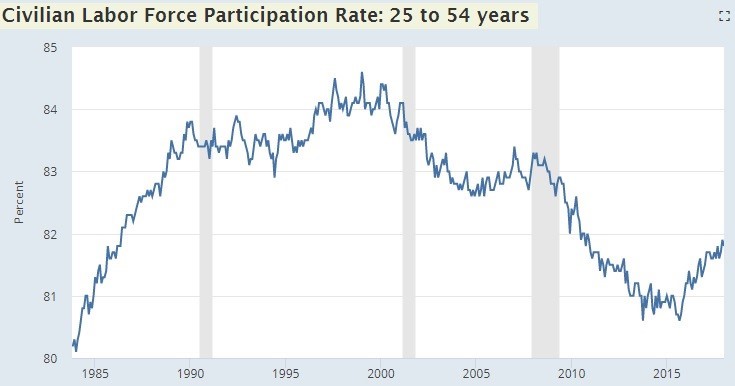
The chart below shows the civilian labor force participation rate for people 25-54 years old. This is slight difference between the employment population ratio for that age group. The labor force participation rate is the number of people who are employed plus the number of people who are unemployed divided by the civilian non-institutional population. The employment population ratio is the ratio of employed people to the civilian non-institutional population. As you can see the labor force rate includes the unemployed folks. Both are important metrics to measure how full the labor market is.
As you can see from the chart, the labor force population rate for prime aged workers is at 81.9%. That’s 2.8% below the peak in 1999 and 1.6% below the peak in 2007. The participation rate fell to 80.6% in 2015 which was the lowest point since 1984. It has only been improving for 2 years. This data starkly contests the information I showed in a previous article where I mentioned most of the counties in Ohio have a low unemployment rate.
I think it’s great to have all the data at hand before making a decision. I can understand why someone would expect a recession in the next 12-24 months based on the jobless claims and the unemployment rate.
Jobless claims increase slightly
Last week was a cycle low in the jobless claims report as they were a remarkable 210,000. Every low report is shocking because it keeps setting a new record for the labor force to jobless claims ratio. A counting stat that gets inflated by the number of workers shouldn’t be making a 49-year low. The claims spiked 21,000 to 231,000 in the most recent report. This was ahead of the top end of the consensus range by 6,000 jobs. Even so, the 4-week moving average only went up 2,000 to 222,500.
The extremely low claims in February combined with the strong ADP report imply the BLS jobs report will show a big gain in job growth on Friday. The expectation is for 205,000 jobs added. I expect that will be beaten. The consensus range is 152,000 to 230,000.
The unemployment rate is expected to fall from 4.1% to 4%. The key will be the average hourly earnings growth which is expected to be 0.2% month over month and 2.9% year over year.
Households have deleveraged
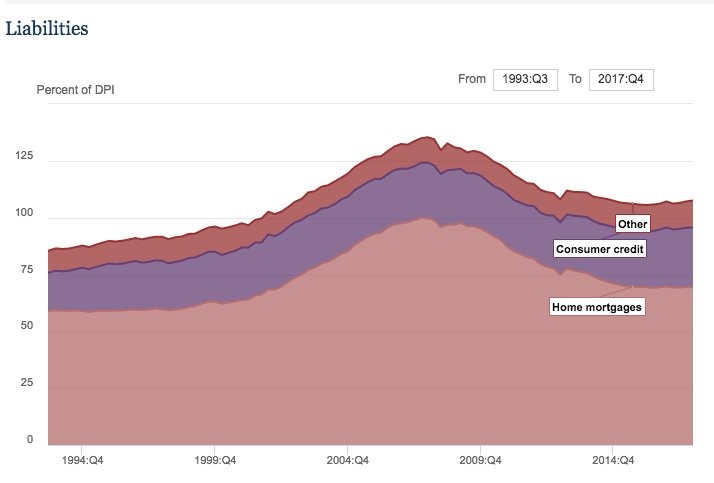
Another argument which makes investors believe the economic cycle isn’t near its end is that the household’s balance sheet has deleveraged. The debt increased to record proportions during the housing bubble because a house is the largest purchase most people make. Some people who shouldn’t have been real estate investors were buying multiple houses. There’s no way for debt on any other asset to reach those historic proportions.
As you can see from the chart below, the debt as a percentage of disposable income is very close to the cycle bottom. This is unusual because the economy has been growing. On the one hand, it’s great that the consumer deleveraged, but on the other hand, it doesn’t necessarily mean the consumer is ready for much more debt. That peak probably won’t ever be met again. It’s like how tech stocks won’t ever trade at the valuations of the late 1990s.
I expect a modest increase in household balance sheet leverage the next couple years. When it falls in the next recession, it might make a new low.
Conclusion
I don’t want to constantly put my opinion that a recession will occur in 2-3 years in articles because there are arguments to the contrary which need to be discussed.
The wage growth is still low; the labor force still isn’t full and the consumer has deleveraged. It’s great to have this discussion now with openness to all sides because it’s so far off. You don’t want to be analyzing situations on the fly and making trades off quick judgments. With that strategy, you will sell every time the financial media writes a scary story.


