

After a Big Up January and a Big Down February, there is Big Confusion. Traders are uncertain if the Emini is about to resume up or sell off further, asserts Al Brooks of BrooksPriceAction.com.
Monthly S&P500 Emini futures candlestick chart:
Bull inside bar in strong bull trend
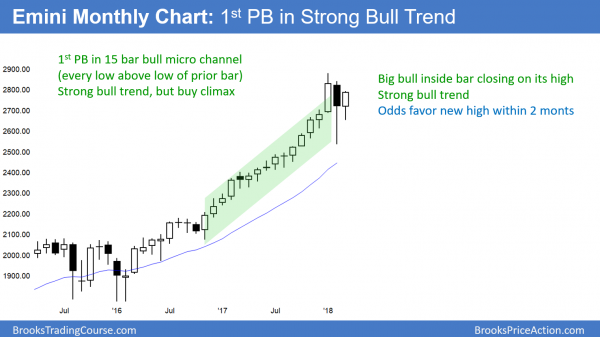
The monthly S&P500 Emini futures candlestick chart has traded sideways for 2 months after 15 months where every low was above the low of the prior month. This month so far is a bull inside bar closing on its high. However, this 2-month pullback might last at another month or two before there is a test of the high.
The monthly S&P500 Emini futures candlestick chart is inside of February’s range, which was huge. The odds are that March will remain an inside bar. If so, it will be a buy signal bar for April. The probability of a rally in April will be greater if March closes on its high.
While an inside bar after a big bear bar is also a sell signal bar, the odds are against a bear trend. Typically, the 1st pullback in a bull micro channel lasts only 1 – 3 bars. Then, the bulls create a rally that tests the old high.
Therefore, if April triggers the sell signal by falling below March’s low, the sell signal will likely fail. The odds are that there will be more buyers than sellers below the March low. This is because April would be the third month in the pullback from January’s high.
Remember, the first pullback from a micro channel typically lasts 1 – 3 months. Therefore, the odds are against a 4 – 6 month correction. In addition, there is only a 20% chance of a bear trend on the monthly chart without at least a micro double top. That would require a test of the January high, which would probably take at least another 1 – 3 months.
Weekly S&P500 Emini futures candlestick chart:
Emini has an ioi High 2 bull flag on the weekly chart
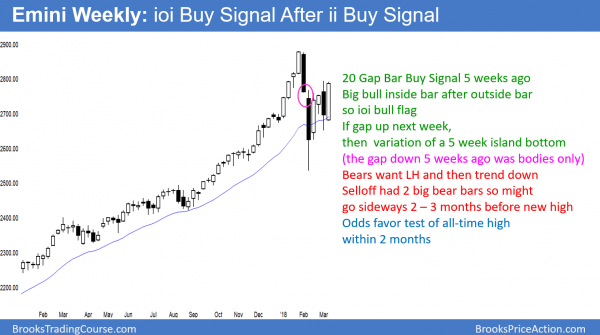
The weekly S&P500 Emini futures candlestick chart formed an inside bar after last week’s outside bar. This is an ioi (inside-outside-inside) pattern. Since it is the first pullback to the 20 week exponential moving average in over a year, the odds favor a bull breakout.
The weekly S&P500 Emini futures candlestick chart sold off sharply in February. The selloff fell below the 20 week EMA for the first time in over a year. Hence, the bulls were willing to buy above the average price for a long time. They are now getting an opportunity to buy down at the average price.
However, the two-week selloff was extreme. Consequently, the bulls are uncertain about whether there might be a second or third leg down. If they can prevent another strong selloff, the bears will buy back shorts. Furthermore, the bulls will begin to buy. This will lead to a rally back up to the January high.
ioi Breakout Mode pattern after an ii bull flag 2 weeks ago
Last week traded above and below the prior week’s range. That prior week was therefore inside of last week, and last week was outside of it. Consequently, last week was an outside week.
This week is within last week’s range. Hence, it is an inside week after an outside week. This is an ioi pattern, which is a Breakout Mode setup. Because it closed on its high, it is a higher probability buy signal bar than sell signal bar for next week.
The bull trend is strong. This is the first pullback to the 20-week EMA in over a year. The ioi is just above the 20-week EMA, and it is a bull flag. In addition, this week has a bull body. Furthermore, the ii from two weeks ago had two good bull bodies. All of this increases the odds of a bull breakout.
Last week was a bear bar, but it was also the entry bar for the breakout above the two-week bull ii pattern of the two prior weeks. The stop for the bulls is below the first of two inside bars. Since last week only traded below the second bar and not the first, the weekly chart is still on that buy signal.
If next week goes above this week’s high, it would be an entry bar for a 2nd buy signal. It would be a breakout of a High 2 bull flag in a bull trend. That is a reliable buy setup.
Tight trading range so lower probability for stop orders
This week was a very big bar. This means that bulls will be buying next week above the top of a 5 bar tight trading range. The bars are big so the risk is big. Therefore, the risk/reward is less.
Also, a tight trading range is a limit order market. This means that in general, it is easier to make money buying below bars and selling above than entering with stops. Hence, buying with a stop above is lower probability. Consequently, while the buy sign is still good, it is less desirable than if this week was smaller.
Will a rally reach a new high?
Because the weekly chart is in a pullback in a strong bull trend, a test of the high is more likely than a bear trend. However, the early February selloff was unusually strong. After a Big Up January and a Big Down February, there is Big Confusion. Traders are uncertain if the Emini is about to resume up or sell off further.
When there is confusion, the Emini usually tests up and down. This is an attempt to determine if the bulls or bears are stronger. After such a strong selloff, many traders do not feel confident that the bulls have back taken control. That means that the trading range will probably continue for a few more weeks.
What about the High 2 bull flag?
It could easily trigger next week and lead to a 50-point rally, but then stall below the old high. A reversal down at that point could last several more weeks. The bears might drive the Emini down to around 2600. Yet, the odds still favor a new high before a break below the February low.
If there was a strong selloff to around the February low, the odds are that traders would buy it. They will buy it even if it breaks below the February low. This is because the monthly chart is in a strong bull trend. Consequently, the correction will probably not get much more than 10%.
Yet, it could grow in terms of time. A chart is made of price and time, and a pullback is a combination of both. The odds still favor a test of the old high within a couple of months. There is only a 30% chance of a bear trend on the weekly chart without first a test of the high.
Island bottom?
The Emini gapped down on the weekly chart 5 weeks ago. While the gap closed that week, the bodies of the gap down bar did not overlap the body of the week before. That is a type of negative gap, and it is still a sign of strong bears. If next week gaps up, that would create a variation of an island bottom. That is a sign of strong bulls. However, it is not especially significant.
Daily S&P500 Emini futures candlestick chart:
Wedge top, but may get one more leg up
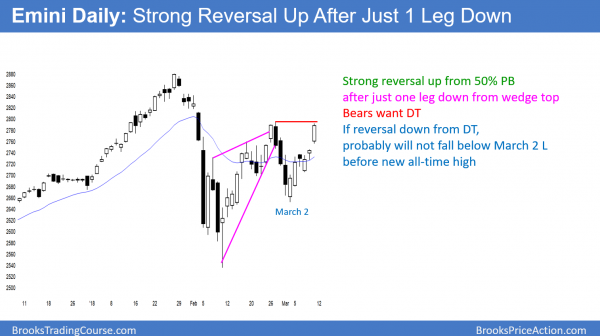
The daily S&P500 Emini futures candlestick chart turned down from a wedge top last week. However, the 6-day rally has been strong. Therefore, last week’s selloff might be a pullback from a second leg up in a bigger wedge. If so, the current rally will go above last week’s high before turning down from a bigger wedge.
The daily S&P500 Emini futures candlestick chart has a wedge top. However, the 6-day rally has been strong. Therefore, rather than last week being the first of two legs down from a wedge top, it might be a pullback from the second leg up in a bigger wedge.
This is especially true because the weekly chart has a buy setup going into next week. If that buy signal triggers next week, which is likely, the Emini will probably rally for 1 – 3 weeks. In addition, it will then go above last week’s high. If it turned down at that point, it would create a larger wedge lower high on the daily chart.
Wedge tops usually lead to 2 legs sideways to down
A correction down from a wedge rally typically has at least two legs down. In addition, the correction usually has about half as many bars as there were in the wedge. The current correction from the February wedge has fewer bars than what was likely, given the number of bars in the wedge. Also, the 6 day reversal up was stronger than the usual bounce up after a first leg down.
Given the buy signal on the weekly chart, it is now more likely that the two-week rally is the third leg up in a bigger wedge than a bounce from the first of two legs down from last week’s wedge top. This means that the rally will probably continue up to above last week’s high. It will probably test the February 27 high of 2794.75. This is the top of the wedge on the daily chart. If the bears can reverse the Emini at that point, there will be a 60% chance of a two legged pullback lasting 2 – 4 weeks.
March 2 major higher low
The March rally has been strong. The March 2 higher low of 2652.00 is a major higher low. If there is a selloff from around the February 27 high, it will probably form a double bottom with the March 2 low.
The bulls would see this as a double bottom higher low. The two reversals up in February were exceptionally strong. In addition, the monthly chart is in a strong bull trend. These factors make it more likely that the bull trend would resume up at that point to the all-time high than sell off to below the February low.
In conclusion, while the February selloff was strong, it probably has ended. If there is a strong leg down, it will probably form a double bottom with the March 2 low. Then, there will probably be a rally up to the all-time high.
Watch Al Brooks discuss how to trade common patterns that form during the first hour in his talk at the recent TradersExpo Las Vegas here.
Traders can see the end of the day bar-by-bar price action report by signing up for free at BrooksPriceAction.com.


