

Traders who take small positions on stocks and ETFs with bullish technicals, use short-term targets for profit taking, and keep cash available are likely to do better than those who buy, hold, and hope, asserts Joe Duarte, MD of Joe Duarte In The Money Options.
There is an old saying on Wall Street; beware the ides of March. Of course, that’s a reference to the fatal stabbing of Julius Caesar by his Senate “buddies” in 44 B.C. and its aftermath. Indeed, there have been some dramatic events in the market and history in previous Marches. And while the ides, March 15, have already passed, there is a certain feeling in the air that the influence of this historical date isn’t quite done with 2018.
Based on what seems to be a collision course of multiple variables, something very dramatic may be on its way for the financial markets as the wall of worry is back while a wall of money is moving into mutual funds just as the Federal Reserve is expected to raise interest rates this week. And when you add the rising political angst inside the beltway as a fourth potentially explosive variable, you have the makings of a wild and woolly period for the stock market in the not too distant future. That’s a lot to sort out, so let’s take it one crazy variable at a time.
First, let’s look at the money angle. According to Bank of America, Merrill Lynch, ETFs and mutual funds that invest in stocks took in a record $58 billion in the past four weeks, as investors bought the dip in prices after the January-February correction. Next, there are two other walls to deal with; one is the wall of worry and the other is the wall of optimism. Here is where it gets a bit dicey. On the one hand opinion surveys show levels of optimism which in the past have preceded market declines or at least a slowing of the rise in prices. On the other hand we have the CNN Greed and Fear Index which uses technical measures to discern the market’s sentiment. This index was at nearly zero within the last two weeks, which is a very bullish reading. And this highly accurate indicator of late, which seems to have a reasonable correlation to robotic algorithm trading, checked in at a nifty Extreme Fear reading of 19 on March 16.
Finally, the Federal Reserve’s Federal Open Market Committee (FOMC) meets on March 20 and 21, and is expected to raise interest rates after the meeting. Furthermore, new Fed Chair Jerome Powell, the new Darth Vader of central bankers, is expected to hold a press conference afterwards. If the news conference is anything like his recent congressional testimony, March 21, just six days after the ides of March may get its own historical date of significance in the annals of the stock market.
NYAD fights for its bullish life
The background for the market is complicated, but the charts certainly have their own contribution to make and some significant color. First let’s look at the most accurate indicator of the price trend since the 2016 presidential election, the New York Stock Exchange Advance Decline line (NYAD).
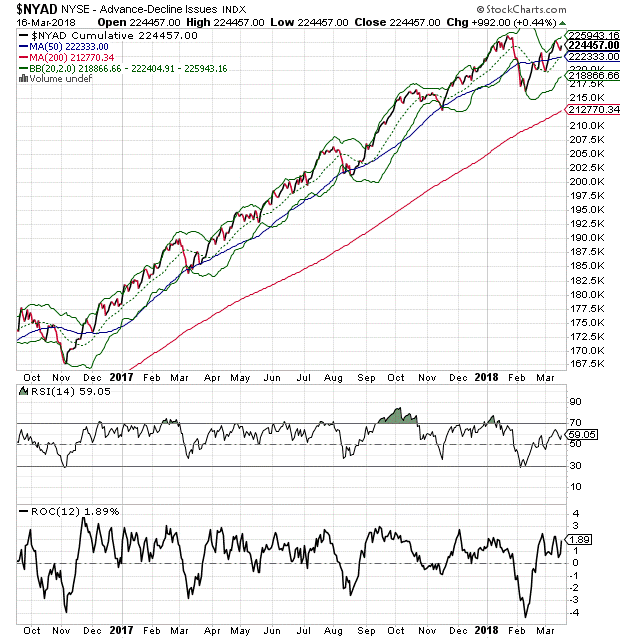
As with everything else in this market, the action in the NYAD is subject to interpretation.
On the plus side, NYAD is making higher highs and higher lows and remains in a short term up trend within reach of a new high to confirm the recent high in the Nasdaq 100 Index (NDX). If that happens, the bull market would likely be fortified and move on to its next uptrend.
The flip side is that if there is another new high by any of the major indexes and NYAD doesn’t confirm soon after the event, we may actually have a negative divergence which may be the prelude to a more significant correction than the recent 12 percent decline we saw a few weeks ago.
S&P 500 walks on egg shells
As with NYAD, the Standard & Poor’s 500 Index (SPX) is also trapped in an uneasy trading range well below its recent highs and has the looks of a teenager trying to sneak into his room after a night out on the town doing things his mother told him not to do.
Indeed, SPX has that look of someone walking on egg shells as it tries to sneak into the next trading day hoping nothing bad happens along the way.
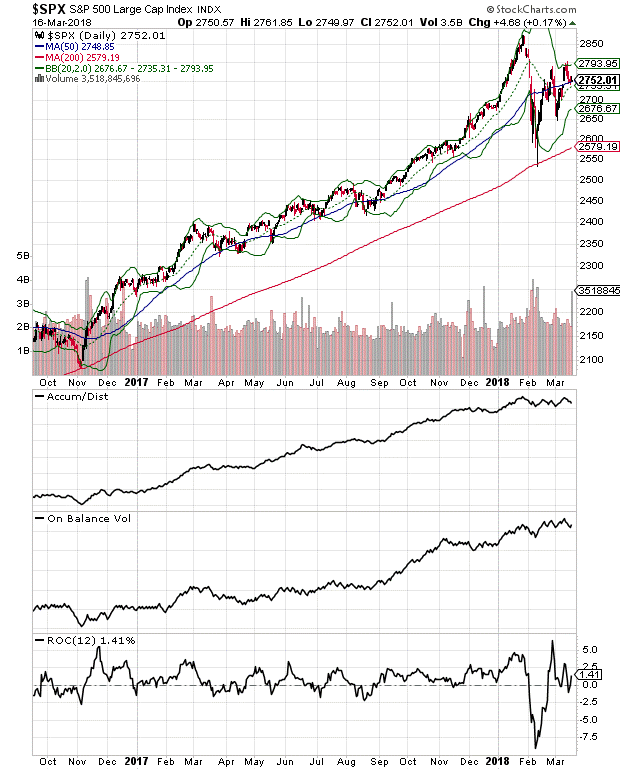
What’s most worrisome is that even though ETFs and mutual funds took in record amounts of money, the Accumulation Distribution (ADI) and On Balance Volume (OBV) indicators for SPX are not showing signs of aggressive stock purchases. In fact, raw volume data, with the exception of the options expiration related spike on March 16, is still anemic.
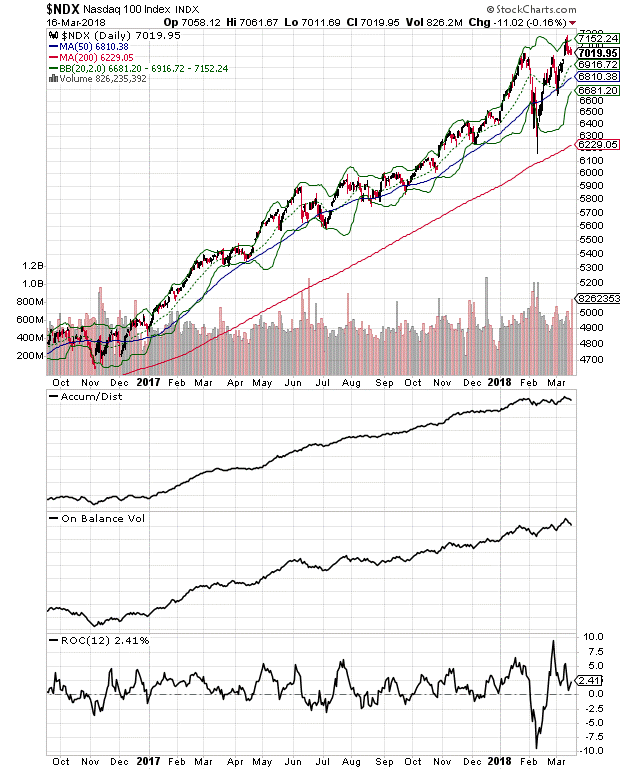
Even more concerning is the lack of follow through on the Nasdaq 100’s (NDX) new all time high scored on March 9. As with SPX, and again despite record money flows into ETFs, NDX seems to be under distribution based on the posture of its ADI and OBV indicators.
Housing stocks on verge of slippery slope
If higher interest rates are indeed the death of bull markets, then the canary in the coal mine could be the interest rate sensitive housing sector. Check out the chart for the SPDR S&P Homebuilders ETF (XHB) which is well off of its recent highs and is tracing a lower high and lower low trading pattern confirmed by very wobbly looking On Balance Volume (OBV) and Accumulation Distribution (ADI) indicators.
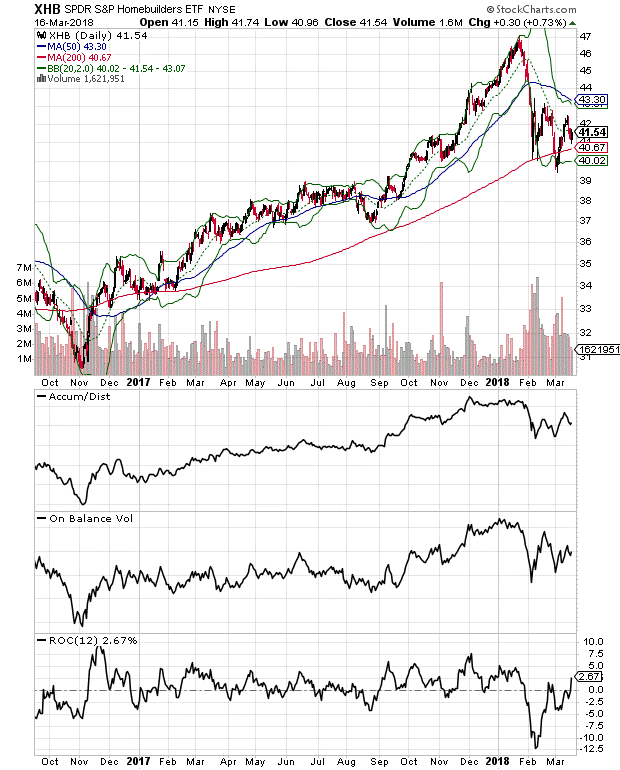
Moreover, with the ROC indicator, a measure of momentum on the rise, it is possible that we are about to see an acceleration of the down side for the housing sector. Given its leadership position in the market over the last year, and given the fact that there is almost no supply of new homes, this sector bears watching very carefully. Accordingly, if housing stocks begin an accelerated bearish phase, the response from the rest of the market will be even more important.
Stay in the trading zone
The data remains inconclusive. At face value, based on the amount of money reportedly coming into this market, stock prices should be booming. Yet, it’s clear that at this point, there are more sellers than buyers, at least based on ADI and OBV analysis of two major indexes. Nevertheless, I’m not totally bearish yet because of the propensity of robot algorithms to buy every single dip in the market.
Still, caution is never out of fashion as the odds of losing big money are much less if you manage your risk appropriately. Thus, I’ve been advocating a trading mindset to this market and I’m sticking to it.
Investors who take small positions on stocks and ETFs that have bullish technical characteristics, use short term targets for profit taking, and keep above average amounts of cash available are likely to do better in the next few weeks to months than those who buy, hold and hope.
Joe Duarte is author of Trading Options for Dummies, now in its third edition. He writes about options and stocks at www.joeduarteinthemoneyoptions.com.


