

If you are a bearish trader, you don’t care if this is a bear trend. All you need to know is that the Emini is falling quickly toward support. You sell because the Emini will likely get closer, allowing you to make money, asserts Al Brooks of BrooksPriceAction.com.
Monthly S&P500 Emini futures candlestick chart:
Bear inside bar, but minor reversal down
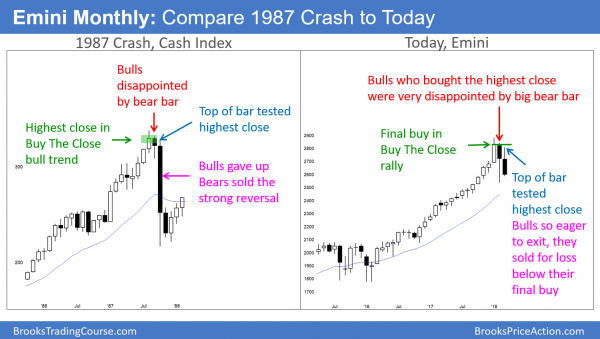
The monthly S&P500 Emini futures candlestick chart on the right has a bear inside bar so far this month. Since the bull trend is strong, the selloff will more likely form a bull flag than a bear trend. However, compare it to the 1987 chart of the S&P500 cash index during the 1987 Crash. Both charts had strong bull trends.
Bulls were buying for any reason, including buying closes. The bulls who bought the highest close were disappointed by the bear bar that followed. They decided to exit on the next bar. You can see that the bar reversed down once it got near the highest close.
The bulls were so desperate to get out that they were willing to sell with a loss to avoid a bigger loss. Those who did not take the opportunity to exit sold out last week, creating a big bear bar.
The monthly S&P500 Emini futures candlestick chart is still in a bull trend, despite the 3-month pullback. Since the selling has been extreme, the bulls may need several more months before they can regain control. After 15 months without a pullback, the odds are this 3-month selloff is just a bull flag.
The bears only have a 20% chance of a bear trend when a bull trend is strong and there is no credible top. At a minimum, they usually need at least a micro double top. Consequently, the downside risk is small, although the selloff still might test the February low, and it might last a few more months.
Comparison with 1987 Crash
In the figure above, you can see some similarities between the monthly chart of today and that of the 1987 Crash. Can the stock market crash again without a strong reason? Well, that is what happened in 1987, so why not?
There was no good reason, yet the stock market fell almost 25% in one day. There was also a Flash Crash in 2010 when the market lost 6% in 35 minutes. Black Swans are real, and they will happen several times in your trading career. No one knows what he does not know. Yet, everyone needs to know that there are things that are impossible to know, and they are extreme.
The market never needs a reason to crash or to do anything. This is because most of the movement, even on the monthly chart, is controlled by computer algorithms. Most are trading technically, and not trading based on fundamentals.
What happened in 1987?
There are some important differences between now and 1987. Then, I was trading back, unlike most of the experts on TV. I didn’t have to read about it to understand what took place. I was there, trading that day.
On the Monday morning of the crash, I shorted heavily just after the open. However, the stock market rallied early, and I had a full surgery schedule. I closed out my shorts for a small loss.
As I drove to work, the Crash began. During my 40 minute drive, CBS News radio in Los Angeles said that the stock market was falling so fast that no one knew how far it had fallen. Furthermore, no one knew the current price of any major average. The computers could not keep up. It was not until the market closed that the exchanges were able to determine the final numbers. The markets lost from 20 – 25%.
The 1987 Crash felt different
Something strange happened back then, and I doubt that I can adequately describe it. It is like trying to describe a smell. On the Friday before the Crash, I had an eerie felling that something terrible was going on. I felt that no one was in control of the markets and that no one understood what was happening.
Today, everyone has a reasonable level of confidence that the Fed, the exchanges, and the major financial institutions are in control. In addition, there is much more confidence in the computer engineers who designed and maintain the economy’s hardware and software.
That was not the case in 1987. It felt like no one was in control on the Friday before the Monday Crash. Moreover, I felt like the market was going to fall sharply. There was no sense that someone was aware of it and that they had a plan. There was no plan.
What caused Black Monday: the stock market crash of 1987?
Where do huge selloffs end?
I want to make one final point about all huge selloffs. They all stop at monthly support. Look at the monthly charts of 1987 and 2008. The institutions bought heavily at the monthly bull trend lines.
Where is the major support now? It is at the bottom of the 2014 and 2015 trading range at 1800. I believe the market will get there at some point in the next 5 – 10 years. There is only about a 10% chance of it getting there now without at least one new all-time high first. Even then, the odds are that it will not happen this year
Weekly S&P500 Emini futures candlestick chart:
Strong sell entry bar
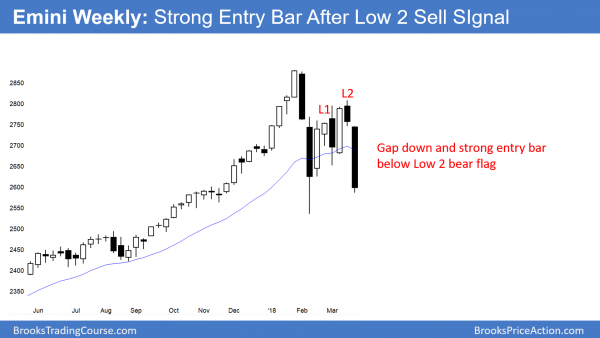
The weekly S&P500 Emini futures candlestick chart had a Low 2 sell signal last week. Last week gapped down to trigger the sell. Furthermore, it was a big bear bar. It will probably test the February low within a week or two.
The weekly S&P500 Emini futures candlestick chart formed a strong entry bar this week, triggering a Low 2 sell signal. The bears want a strong 2nd leg down from the 2-week selloff in early February.
On the other hand, the bulls know that the odds are against a bear trend since the yearlong bull trend was so strong. However, they twice triggered buy signals over the past month. Both failed. When the market tries something two or more times and fails, it usually tries the opposite direction.
That explains the past 2 weeks. What traders do not yet is whether this 2 week selloff is the start of a bear trend or simply a leg in the trading range. Because the 2017 bull trend was strong and there was no clear top, the weekly chart is probably forming a lengthy bull flag. The damage this week is significant. Yet, the odds are that there will be a rally to a new high by this summer. The bears need a strong break below the February low before traders will conclude that the weekly chart is in a bear trend.
A 2nd leg down can be a big, fast 2nd Leg Trap
More likely, a break below the February low will not last more than a few weeks. A second leg down is often very big and fast. The bears hope that it is a breakout into a new bear trend. There is a small chance that the Emini might fall far below the February low.
Yet, if it did, the breakout would probably fail. Furthermore, once the bears realized that they were trapped, the rally up could be violent. This type of a failed bear breakout where the 2nd leg strongly breaks below support, but then reverses sharply, is a 2nd Leg Trap.
Daily S&P500 Emini futures candlestick chart:
Trump’s China tariffs causing Emini selloff to test February low
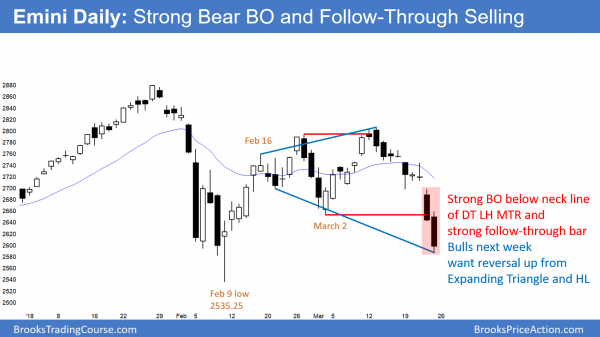
The daily S&P500 Emini futures candlestick chart broke strongly below the neck line of a double top on Thursday. The strong follow-through selling on Friday makes lower prices likely. If there is a reversal up next week, it would form an expanding triangle that began with the February 16 high.
Despite the strong two-week selloff, the daily S&P500 Emini futures candlestick chart is still in a 2- month trading range. Last Thursday and Friday were big bear trend bars closing on their lows. This is now a confirmed break below the March 2 low. That increases the chance of at least slightly lower prices next week. The selling was so strong this week that it will probably result in lower prices for several weeks.
There is now a 60% chance that the Emini will fall below the February low. However, there is only a 30% chance of a 20% correction. The odds are that the Emini will reverse up from around the February low within a couple of months.
Because at least 1 more leg down is likely, traders will sell the first reversal attempt. Therefore, there will probably be at least a small 2nd leg down.
Since the selloff has been strong, the Emini will probably have to transition into a 1 – 2 week trading range or double bottom before the bulls can regain control. This will probably take at least several weeks.
However, there is a 30% chance that the correction will end within a week or two. A successful reversal up would be from an Expanding Triangle that began with the February 16 high, and from a double bottom with the February low.
Sell vacuum test of support, or actual bear breakout?
There are two possible reasons why last week sold off strongly. The obvious one is that the Emini might be entering a bear trend. The more likely reason is that traders now believe that the Emini will test the February low. If you are a bull, why buy now if you think the Emini will fall another hundred points? The absence of buyers at the current price causes the market to get vacuumed down to support, where there are probably many buyers.
If you are a trader who is bearish, you don’t care if this is the start of a bear trend. All you need to know is that the Emini is falling quickly toward support. You, therefore, sell because the Emini will likely get closer to support, allowing you to make money.
You know there are no buyers here, but there might be many down at and below the February low. That means the market is getting vacuumed down to support where the next group of big buyers will buy. Because a sell vacuum is a quick test of support, once the Emini reaches that support, many bears buy back their shorts.
If there are many institutions waiting to buy lower, down at support, they, too, will buy. The result of the bears buying back their shorts and the bulls buying aggressively, believing the market is now cheap, is often a very sharp rally. The bear breakout fails and last year’s bull trend resumes strongly.
More likely, after this much selling, the bulls will probably need several small reversals up before traders think that the selling has ended. Consequently, it will probably take 1 – 2 months before there is a credible bottom.
Watch Al Brooks discuss how to trade common patterns that form during the first hour in his talk at the recent TradersExpo Las Vegas here
Traders can see the end of the day bar-by-bar price action report by signing up for free at BrooksPriceAction.com.


