

Confusion is a hallmark of a trading range. Consequently, there is a 50% chance that the monthly chart will continue sideways for six months or more, asserts Al Brooks of BrooksPriceAction.com.
Monthly S&P500 Emini futures candlestick chart:
Emini monthly chart should reverse up in April from February low
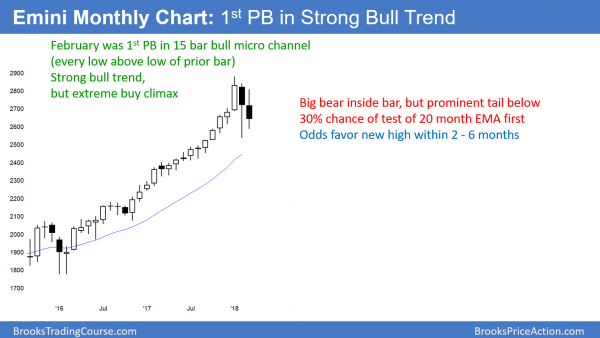
The monthly S&P500 Emini futures candlestick chart had a bear inside bar in March after February’s big bear bar. Both bars have big tails below, which is a sign that the selling is not as strong as it could be. This is a 2-bar pullback in a strong bull trend.
Because the monthly S&P 500 Emini futures candlestick chart had a Big Up move last year and a two- month Big Down move this year, there is now Big Confusion.
There is only a 30% chance of a 20% correction at this point. However, traders do not know if the current correction has reached its bottom. There is no sign yet on the monthly chart.
While the monthly chart is in a strong bull trend, the past 2 months have had big bear bars. Since February and March have big tails below and both are in a strong bull trend, March is a weak sell setup. Yet, the 2 big bear bars make it likely that traders need to find out if the bears can get another leg down.
There is at least a 50% chance that April will trade below March’s low. If it does, April will probably reverse up from around the February low. Less likely, it will test below the 20-month EMA to around 2400.
Possible ii bull flag
Alternatively, April will not fall below March’s low. If that is the case, April will probably be a bull bar. If so, it would likely be inside of March, which is inside of February. Hence, April would then be an ii bull flag (consecutive inside bars).
May would then probably trade above April’s high, triggering the buy signal. That would probably lead to a new all-time high in May or June.
Weekly S&P500 Emini futures candlestick chart:
No follow-through selling, but 50% chance of test of February low
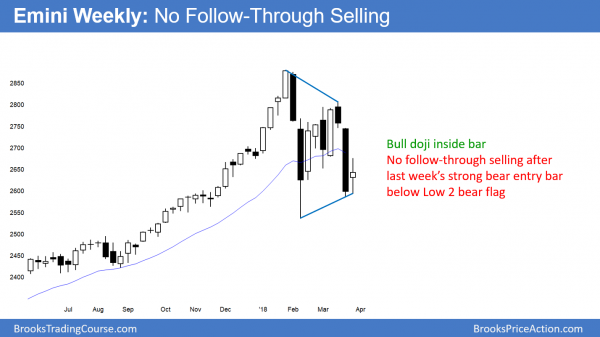
The weekly S&P 500 Emini futures candlestick chart has been sideways for 2 months. There is both a lower high double top and a higher low double bottom. Consequently, it might be forming a triangle.
The weekly S&P 500 Emini futures candlestick chart formed a bull doji this week after last week’s big bear bar. This is a lack of follow-through selling and it reduces the chances of much lower prices. However, the odds favor at least a small second leg down after the big selloff two weeks ago. Because there is no strong top and the chart has been in a strong bull trend, the two-month trading will probably have a bull breakout.
A trading range always has both a buy and a sell setup. The bears have a lower high major trend reversal. That is a type of double top. The bulls, however, see a double bottom bull flag. Since the legs up and down have been strong, there is an increased chance of additional legs. If there is a rally to a lower high, the trading range will be a triangle.
Small chance of bear trend
Changing the name of the trading range to a triangle does not change the probabilities. The odds still favor a resumption of the bull trend instead of a reversal into a bear trend. Yet, the February selloff was exceptionally strong. There is a 50% chance of the current second leg down falling below the February low. If it does, the odds are that the bear breakout will fail and the bull trend will then resume.
There is a 30% chance of a big breakout below that February low. A Leg 1 = Leg 2 measured move would be to around 2450. There is a 20% chance of a measured move down based on the 300-point height of the February selloff. That would test the top of the 2014 – 2016 trading range, just below 2200.
Daily S&P500 Emini futures candlestick chart:
Bear flag at 200 day moving average support
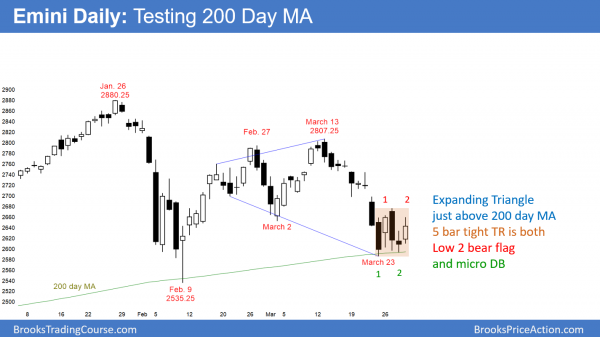
The daily S&P500 Emini futures candlestick chart is in a 5-bar tight trading range, which always has both a buy setup and a sell setup. Thursday’s reversal up was a small bull bar with a tail on top. This is weak buying, and it followed a bear bar. That is a weak buy setup, and it therefore makes a bear breakout more likely. The bulls want a reversal up from an expanding triangle above the 200-day moving average.
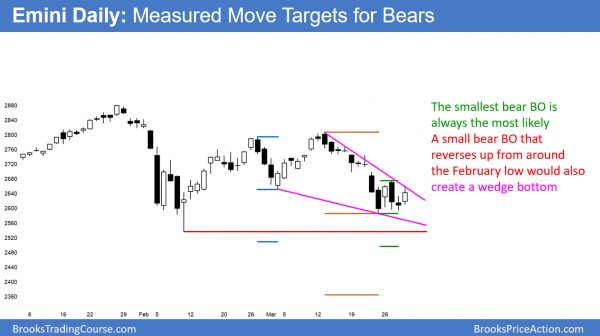
This is the same daily chart, but it shows measured move targets. If the Emini breaks below the small bear flag, it will probably fall for a measured move down. A reversal up from a move based on the height of the 5-day small trading range would create a lower low (green line) double bottom with the February low. In addition, that would be a wedge reversal (pink lines). There is a 30% chance of a 300-point measured move down to around 2350 (gold line).
The daily S&P 500 Emini futures candlestick chart reversed up strongly from the 200-day moving average in February. While it is testing it again, the bulls have been unable to create a strong reversal up this time. This means that the bulls are not strong, and the chart looks “heavy.” Therefore, the 5-day tight trading range is more likely a bear flag than a micro double bottom.
Since the monthly chart is in a bull trend, any selloff on the daily chart will probably end within a month. The odds are that there will be a reversal up to a new high within a few months. However, the bulls do not yet have a high probability bottom. Furthermore, the momentum down favors a test of the February low within a week or so. If the bulls fail to get a credible bottom at that point, the next target is below 2400.
Even without a strong buy signal bar, the bulls can begin a trend up to a new all-time high at any time. They would need at least two consecutive big bull days before traders would conclude that the reversal up has begun.
Measured move targets for the bears
Unless the daily chart reverses up strongly next week, the odds are that it will break below the 200-day moving average. If so, traders will look for a measured move down.
The first target would be an 80-point selloff based on the height of the 5-day tight trading range. That would result in a test of the February low. A reversal up from there would be a double bottom with the February low. Furthermore, it would be a wedge bottom with the March 2 and March 23 lows.
If the selloff breaks far below the February low, the next measured move target is around 2500. That is a measured move based on the February 27 and March 13 double top.
The final measured move target from a strong breakout below the 5-day range is from the March 13 high to the March 23 low. That is around 2350.
Watch Al Brooks discuss how to trade common patterns that form during the first hour in his talk at the recent TradersExpo Las Vegas here.
Traders can see the end of the day bar-by-bar price action report by signing up for free at BrooksPriceAction.com.


