

If there is a selloff this week and it is strong, the odds would favor a break below the triangle and the February low. A measured move down would be around 2430, which is also a target zone on weekly and monthly charts, asserts Al Brooks of BrooksPriceAction.com.
Monthly S&P500 Emini futures candlestick chart:
Trying to resume up after a 3-month pullback.
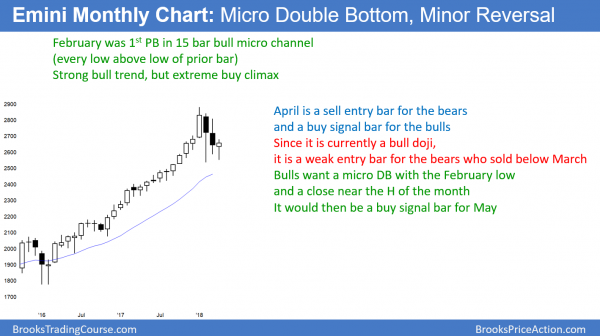
The monthly S&P 500 Emini futures candlestick chart so far this month is a bull reversal bar. The odds favor a resumption of the strong bull trend either this month or next. Yet, the 20-month exponential moving average (EMA) is a magnet and it is not far below. Consequently, the pullback might continue down to the 2450 area before the bull trend resumes.
The monthly S&P500 Emini futures candlestick chart has pulled back for 3 months in a strong bull trend. Through January, the bulls had 15 months without a pullback. While unsustainable and therefore climactic, it also means that the bulls were aggressive. The odds are that the current reversal down will fail and the bulls will buy again soon.
Normally, the first pullback from a bull micro channel lasts only 1 – 3 months. Because the stock market has never been this overbought in its 100-year history, the pullback could last longer. If April closes on its high, it will be a buy signal bar for May. Furthermore, it would probably be the end of the pullback.
Alternatively, if the Emini collapses into the end of the month, then it will probably fall to the 20-month EMA. Since it would probably go at least a little below, a minimum target would be about 2450.
Weekly S&P500 Emini futures candlestick chart:
Emini bulls want measured move up and bears want Leg 1 = Leg 2 down
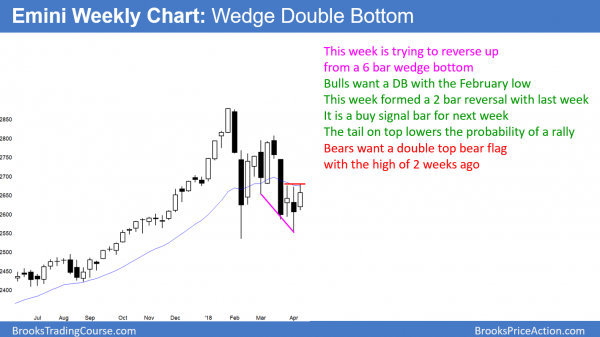
The weekly S&P500 Emini futures candlestick chart had a bull trend bar last week. It is a buy signal bar for this week for a double bottom with the February low.
The weekly S&P500 Emini futures candlestick chart reversed up last week after the previous week’s higher low double bottom with the February low. Furthermore, there was a 6-week wedge bull flag at the previous week’s low. If the bulls get a strong bull trend bar this week, then the odds are that the rally will continue up to the March 13 lower high at around 2800. That is around a measured move up based on the height of the 3-week tight trading range.
The bears want a Leg 1 = Leg 2 measured move down
The bears need more than a reversal down this week. They need a strong break below the February low before traders believe that the Emini will have another leg down. Their first target would be a Leg 1 = Leg 2 measured move. Leg 1 ended with the February 9 low, and it was 345 points tall. Leg 2 began with the March 13 high of 2807.25. The leg 2 target would be around 2462.25. Hence, it would be around the 20-month EMA, which is a target on the monthly chart.
Daily S&P 500 Emini futures candlestick chart:
Triangle just above the 200-day moving average
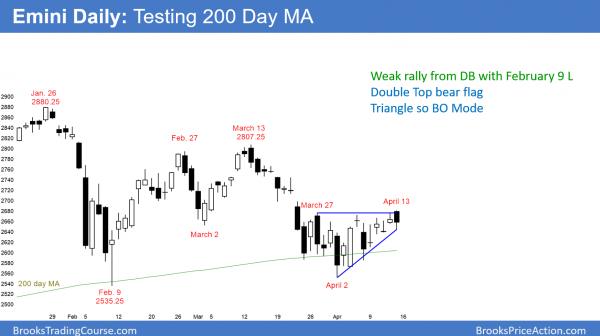
The daily S&P500 Emini futures candlestick chart today reversed down from a small break above a 3- week triangle. It is still in breakout mode.
The daily S&P500 Emini futures candlestick chart has been sideways for 3 weeks. April 13 it reversed down from a small breakout above the triangle. But, it closed back above the April 12 low. The chart is still in breakout mode until there is a clear breakout up or down. The next few days will give information about what the next couple of weeks will do.
The bulls want a reversal up from a test of the February low and the 200-day moving average. However, the bulls need consecutive bull bars closing near their highs and above the triangle. If they get that, the odds would favor a test of the March 13 major lower high, which is above 2800.
The bears want consecutive big bear bars this week for a break below the triangle. That would make a test of the February low likely. If there is a selloff this week and it is strong, the odds would favor a break below the triangle and the February low. A measured move down would be around the 2430 area, which is also a target zone on the weekly and monthly charts.
Watch Al Brooks discuss how to trade common patterns that form during the first hour in his talk at the recent TradersExpo Las Vegas here
Traders can see the end of the day bar-by-bar price action report by signing up for free at BrooksPriceAction.com.


