

I may be overplaying the contrarian card. It looks like the most under-loved stock market in the past 18 months is setting up for what could be a fairly profitable trading rally. A little-followed technical indicator is flashing a bullish alert, says Joe Duarte, MD.
The quants, the fundamentalists, the hedge funds, the mutual funds, the pension funds, the central banks and the CFA crowd of analysts and traders may be ignoring the alert altogether.
I know, the bull market has been in play since 2009, the Fed is raising rates, the political environment is not just toxic bur radioactive, and the economy may be slowing in some parts of the country given the recent GDP and other fundamental indicators. And yes, technology stocks have been in a funk while the bond market has been a boon for short sellers. No wonder just about everyone is bearish, especially when few can make sense of the robot stranglehold on the major indexes, and hedge funds are in some cases shutting their doors. But be that as it may, the charts are suggesting that this old bull may still have a bit of fire left in its belly.
Sneak like a bot: three times a charm
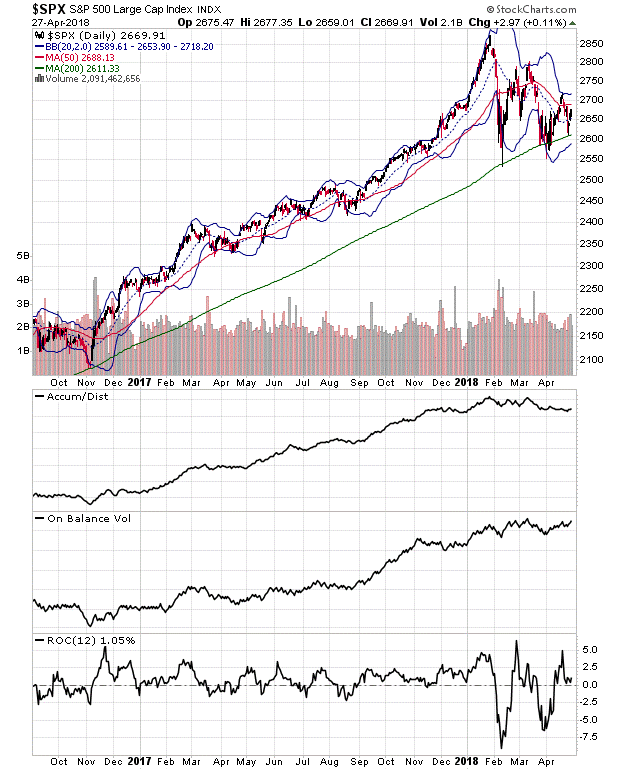
As I went through my weekly charts I noted something encouraging for once. Yes, I said encouraging, and even surprising – the stock market, as measured by the S&P 500 (SPX) and the Nasdaq 100 (NDX) indexes seems to have found support, not once or twice, but actually three times at the respective 200-day moving average for these two well-known benchmarks over the last three months. To traditional technical analysts, and especially simple-minded bots, this is bullish as all get-out.
And while I could write about this stuff all day, it seems that something this simple and seemingly insignificant in a world of quantitative analysis and other esoteric portfolio management techniques – this one and nearly forgotten simplistic indicator would be the one not to ignore. Strangely enough, it would be also par for the course for this to be the key in a market which is dominated by robotic trading algorithms that trade stocks based on words and phrases found in news headlines while using simple technical support and resistance levels – such as the 200-day moving average – as launching pads for moving the market. Moreover, since investors are so worried about the world at the moment that in some cases they aren’t paying as much attention to what’s really happening, the bots would have the element of surprise on their side.
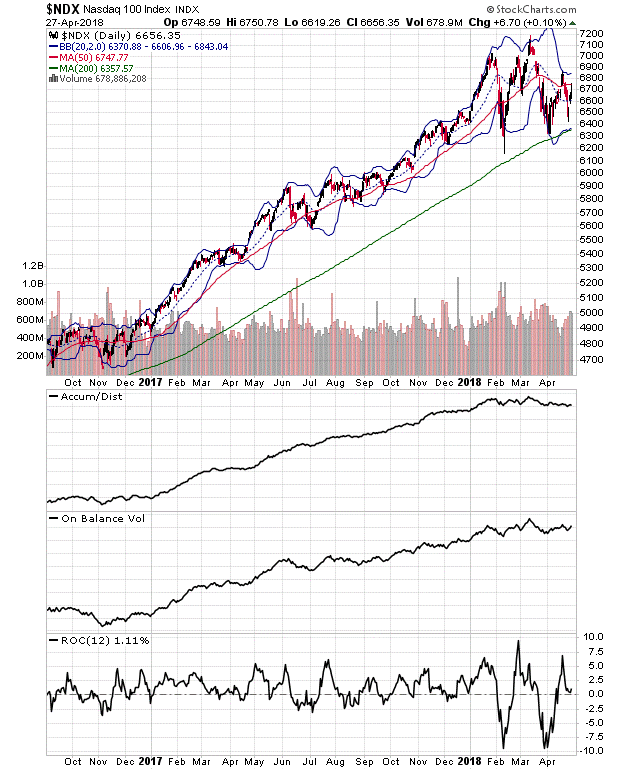
So, what’s the really bullish finding on these charts? Aside from the obvious triple bottom at the 200-day moving averages, a development which would have made technicians go crazy in the 1970s, there are two other major developments.
– One is that volume is picking up, on both NDX and SPX, especially on rally days while On Balance Volume (OBV) is also rising.
– The other is that the ROC indicator for both the NDX and SPX indexes stopped falling and turned up at the end of the week – above the zero line. Combined, these key technical events suggest that money is tiptoeing back into stocks just as momentum to the down side seems to have run its course.
And although this sudden turn of events may be a quickly reversed short-term phenomenon, until proven otherwise it’s a stark change from the market’s recent behavior where low volume grinding days have taken the market to nowhere. Furthermore, when you consider the fact that money seems to be sneaking back into the markets after the three reversals in price for the major indexes at the very simple and basic, no need to think technical indicator support level which is the 200-day moving average – a level which few people follow anymore, it’s a recipe for a bullish algorithm blitz on stocks.
Finally, the most accurate indicator of the overall market trend, the NYSE Advance Decline line (NYAD) is also moving in lockstep with the markets after finding its own support level last week, also for the third time at its lower Bollinger Band.
A perfect sneak attack from the bots on the unsuspecting
Wouldn’t this be the perfect setup for a robot sneak attack on unsuspecting bearish investors? It seems that something as overlooked by sophisticated technical analysts who avoid the simple indicators loved by the bots is just the right ticket. What I’m saying is that something as obvious as three successful tests of the 200-day moving average on the major indexes coupled with rising bearish sentiment, including a major headline last week caused by a highly respected market technician, Thom McClellan that a bear market had arrived, would be the just the ticket for the robot army to launch a rally over the next two to four weeks. Moreover, think of the carnage such a rally would cause at a time when large numbers of investors are increasingly frustrated and some are even throwing in the towel for 2018.
I may be wrong. But even in the era of the robots, the market still looks to make fools of as many investors as possible at any one time. When downside momentum is done, money is moving back in the markets and everyone is bearish, the odds usually favor the bulls.
Finally, and I am not recommending this to anyone by any means, if I was running a robot trading farm, knowing how all the other robot farms think and how they program their trades, I’d be betting the entire farm, and theirs, on these technical findings.
Take this home. Never trust a robot, especially when their only job is to take your money.
Joe Duarte is author of Trading Options for Dummies, now in its third edition. He writes about options and stocks at www.joeduarteinthemoneyoptions.com.


