

If April closes on its high Monday, the odds of a rally in May increase. The all-time high is close enough so that a strong May rally could exceed it. Even if the three-month pullback continues through summer, the odds still favor a new high, says Al Brooks Saturday.
Monthly S&P500 Emini futures candlestick chart:
April is buy signal bar in bull flag
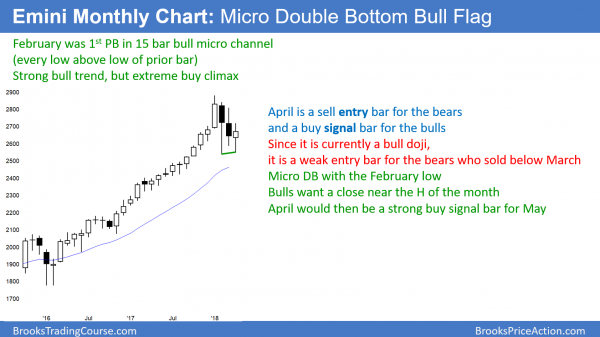
The monthly S&P500 Emini futures candlestick chart is forming a bull reversal bar for April with one trading day remaining. It is the third month in a bull flag after a very strong bull trend, and a buy signal bar for May.
The monthly S&P 500 Emini futures candlestick chart so far this month is a buy signal bar in a three-bar bull flag. Once February traded below the January low, the 15-month bull micro channel ended. Since the rally was the most overbought in the history of the stock market, it was a buy climax. However, a strong bull trend only has a 20% chance of becoming a bear trend without at least a micro double top. Therefore, the three-month selloff is much more likely to be a bull flag than the start of a bear trend.
The first correction in after a micro channel typically lasts 1 – 3 bars. Because this is the most extreme buy climax in history, the bulls are more exhausted that after prior buy climaxes. Consequently, they may want more time before buying again. As a result, this pullback could last several more months. Yet, the odds still favor a test of the all-time high. In addition, that test will probably take place in the next few months.
The bear case on the monthly chart
There is always a bear case. Since there is only a 20% chance of a bear trend on te monthly chart without a test of the January high, what is left for the bears? They could simply delay the resumption of the bull trend, and they can make the pullback continue down further. While the correction could last 10 – 20 bars, that is unlikely.
What about a deep correction? The 20-month exponential moving average (EMA) is just below 2500 and the monthly chart has not touched it since March 2016. That is a long time to stay above the average price and therefore the odds favor a pullback to the average within a year or so. In addition, it is support, and support is a magnet. The April low might be close enough so that the Emini might not be able to escape its magnetic pull. If that is true, the rally will not resume until the monthly chart dips below the 20-month EMA.
When a chart stays above its average price for 20 months, the bulls are strong. There is a gap between the low of every bar and the moving average. Once traders finally get an opportunity to buy at the average price, they usually take it. I call that a 20 Gap Bar Buy Signal.
Consequently, there are buyers below 2500. In fact, there are probably so many that the chart will probably not fall more than 50 – 100 points below its average price before the bulls regain control.
Support at start of parabolic buy climax at the November 2016 low
If the bears break below that support, the next support is the March 2017 low of 2321.75. That was the first pause after the very strong four-month rally that began with the November 2016 Trump election. It was the start of the parabolic buy climax that ended three months ago. Traders will want to see if the bulls will again buy aggressively there. However, the odds are that the Emini will first make a new high before it tests that low. That test will more likely come 12 – 24 months from now.
Weekly S&P500 Emini futures candlestick chart:
Emini in triangle ahead of FOMC meeting despite strong earnings
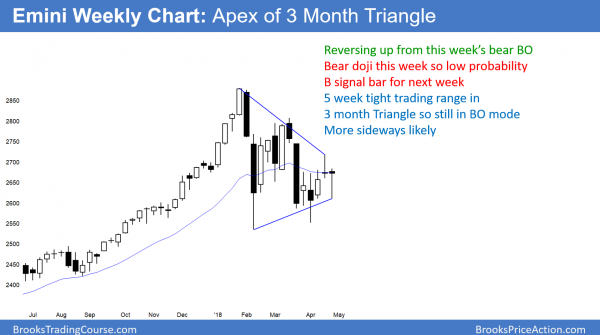
The weekly S&P500 Emini futures candlestick chart formed a double bottom with the February and April lows. The bulls see last week’s selloff as a test of the double bottom. Furthermore, last week is a failed breakout below a triangle, where the previous week was the sell signal bar.
The weekly S&P 500 Emini futures candlestick chart is in a three-month trading range in a bull trend. It has been sideways for three months with lower highs and higher lows. That is a triangle. Last week traded below the previous week’s low and triggered a sell signal. Since the first breakout attempt from a triangle fails 50% of the time, it is no surprise that last week reversed up.
This week is now a buy signal bar for next week. However, the weekly chart has been reversing every 1 – 2 weeks for three months. Therefore, betting on a breakout into a trend is a low probability bet. The setup is good for the bulls, but they need a strong rally this week before traders will believe that the bull trend is resuming.
Daily S&P500 Emini futures candlestick chart:
Reversing up from higher low major trend reversal
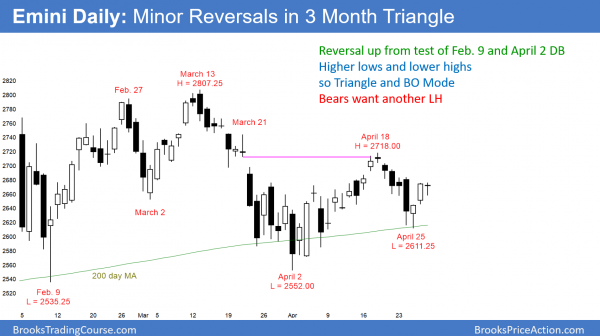
The daily S&P 500 Emini futures candlestick chart sold off strongly last week, but reversed up equally strongly since Wednesday. The bulls see the five-day selloff that ended on Wednesday as a pullback from the April breakout above the February and March bear channel.
The daily S&P 500 Emini futures candlestick chart tested the February and April double bottom this week and reversed up strongly. If it can create several strong bull bars this coming week, traders will conclude that the correction is over and that the bull trend is resuming.
It is important to remember that the daily chart is still in a three-month trading range. Trading ranges repeatedly disappoint traders. Consequently, the odds will favor a continuation of the trading range over a resumption of the bull trend until the bulls are able to get 3 – 5 big bull bars closing nears their highs.
With the uncertainty surrounding Wednesday’s FOMC announcement, the Emini might go sideways into the report. However, the report could be a catalyst for a strong rally that confirms that the bull trend is resuming.
Lower highs mean possible bear trend
A trading range always has both bull and bear setups. The Emini has been forming lower highs since January. If it turns down sharply this week from below the April high, the odds will favor another test of the bottom of the three-month range. If the bears get a strong breakout below, they will try for a 250-point measured move down.
This is based on the height of the February and April double bottom. The March high is the neck line and it is about 250 points above the low. Since a trading range is a breakout mode pattern, traders are looking for a 250-point breakout up or down. At the moment, the bull case is more likely, but the probabilities can reverse after any day in a trading range.
Watch Al Brooks discuss how to trade common patterns that form during the first hour in his talk at the TradersExpo Las Vegas here.
Traders can see the end of the day bar-by-bar price action report by signing up for free at BrooksPriceAction.com.


