

State of the market—The unfavorable May-October period begins with a limp market and rising interest rates. Our intermediate-term U.S. equity model is now on Hold, writes Marvin Appel, MD, PhD Wednesday.
In the middle of April it looked as if U.S. stocks might claw back some of their losses in February and March, but most of those mid-April gains fizzled by month-end.
It appears that the S&P 500 (SPX) will again test its 200-day moving average, which has been a source of price support for almost three months.
The chart on shows that the S&P 500 SPDR (SPY) should enjoy significant support between the closing lows of the past three months (around 257) and the 200-day moving average (around 261).
The 257-261 price range also includes the lower Bollinger band (around 260), which itself frequently represents support areas, especially in a sideways market. As a result, I am not worried about a significant extension of the decline from the Jan. 26 market peak.
Option implied volatility, the CBOE S&P Volatility Index, (VIX) is a lot lower now than it was during previous tests of the 200-day average.
I view this as reassuring, suggesting that the markets have priced in the rise in 10-year Treasury yields to the 3% level and are not bracing for worse.
Our intermediate-term U.S. equity model is now on Hold.
This means that risk is increased compared to Buy, but historical precedent suggests that the market climate should remain profitable.
As a result, our clients’ accounts (and the newsletter portfolios) will maintain their current levels of equity exposure.
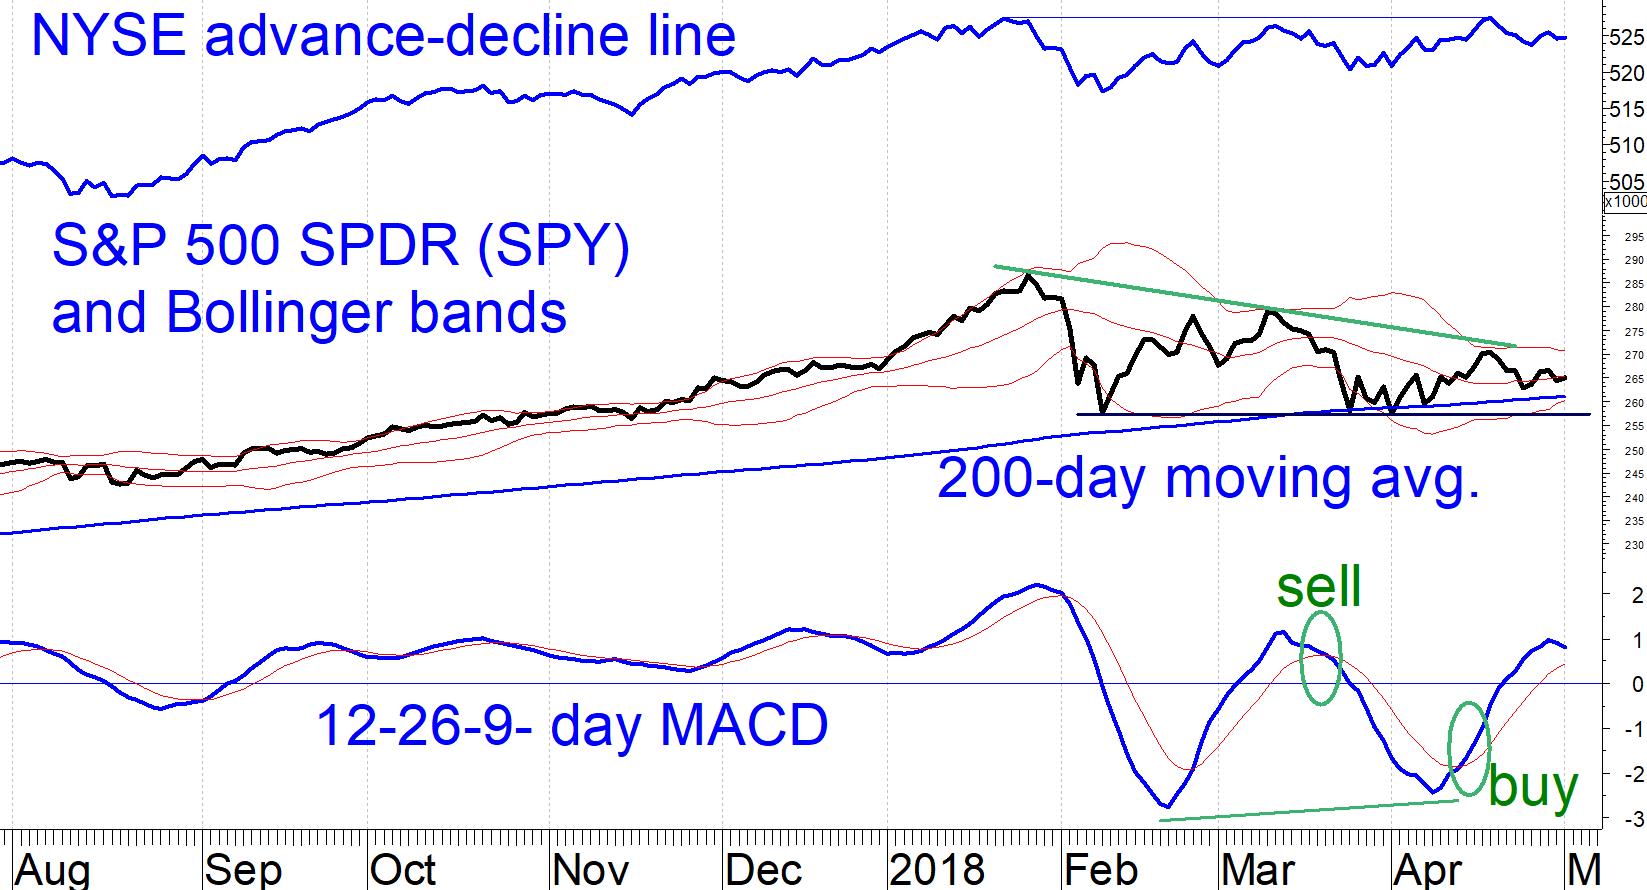
The chart of SPY is overall neutral. MACD has given alternating buy and sell signals. SPY should enjoy strong support between 257 (lows in Feb.-April) and 261 (200-day average). Breadth is holding up better than price, which is a good sign that any upcoming correction should be limited.
Subscribe to investment newsletter Systems and Forecasts here…


