

If the 2-day rally continues next week, this month would begin to be a strong bull trend bar. If this month closes above April’s high, the bull trend will probably resume. The target is a new all-time high, says Al Brooks Saturday.
Monthly S&P500 Emini futures candlestick chart:
4 month tight trading range and bull flag
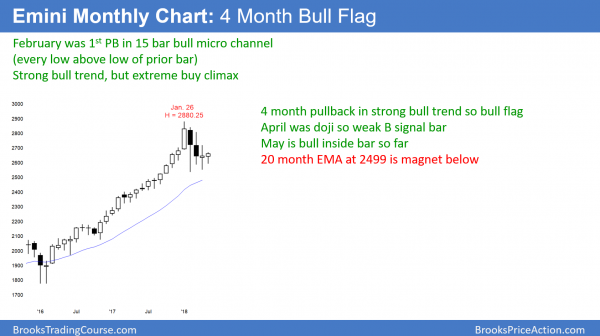
The monthly S&P 500 Emini futures candlestick chart so far this month is a small bull inside bar. Furthermore, last month was also a bull doji bar. The bulls need a breakout above last month’s high.
The monthly S&P 500 Emini futures candlestick chart is in a 4-month pullback in a strong bull trend. The odds therefore are that the bull trend will resume and not reverse. However, the reversal up has not yet begun on the monthly chart. The bulls need May to trade above April’s high before traders will conclude that the bull trend is resuming.
This month so far is a bull doji. If the 2-day rally continues next week, this month would begin to be a strong bull trend bar. If this month closes above April’s high, the bull trend will probably resume. The target is a new all-time high.
By going sideways, the monthly chart is getting close to its 20-month EMA. That is support and therefore a magnet. It might now be close enough to be unable to escape the gravitational pull. Therefore, there is still a 40% chance that the Emini will sell off to below the 20-month EMA before the bull trend resumes. The average currently is 2499. If the Emini sells down to it, it probably will fall at least 50 points below before reversing up.
First pullback in bull micro channel
The monthly chart went 15 months without a pullback. Typically, the bulls buy the first 1 – 3 bar (month) pullback in a micro channel. But, this was the most extreme buy climax in the 100-year history of the stock market. Therefore, the bulls are more exhausted than after prior buy climaxes. Consequently, they might need more than the usual 3 bars before they buy again. Yet, there is only a 20% chance that this pullback will grow into a bear trend without first testing the January high.
Weekly S&P500 Emini futures candlestick chart:
Triangle with micro double bottom buy setup
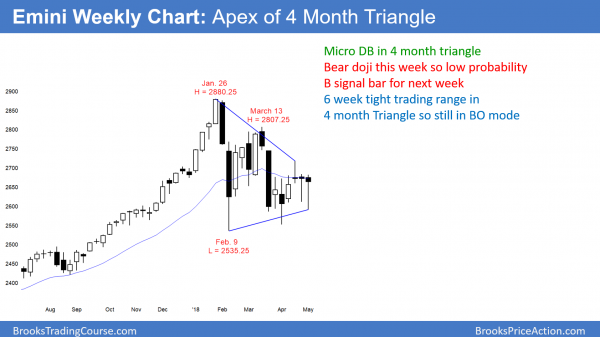
The weekly S&P 500 Emini futures candlestick chart is in a 4-month triangle. Since this week formed a micro double bottom with last week, it is a buy signal bar for next week.
The weekly S&P 500 Emini futures candlestick chart has been in a triangle for 13 weeks. Since the trading range is less than 20 weeks, it is still a pullback in a bull trend. That means that it is a bull flag. Consequently, the odds are greater that there will be a successful bull breakout than a successful bear breakout.
The past six weeks have been in a tight trading range. Five of the bars were dojis. This means that there is no sign of a breakout up or down. However, the past two weeks were dojis that closed near their highs. This is buying pressure. In addition, last week is a buy signal bar for next week. If this week trades above this week’s high, it will trigger the buy signal.
Yet, the Emini is in a trading range and most breakout attempts fail. The bulls therefore need this week to be a bull trend bar that closes near its high. If the bulls achieve that goal, the odds will be that the bull trend is resuming.
Daily S&P500 Emini futures candlestick chart:
Emini triangle buy signal but needs follow-through buying
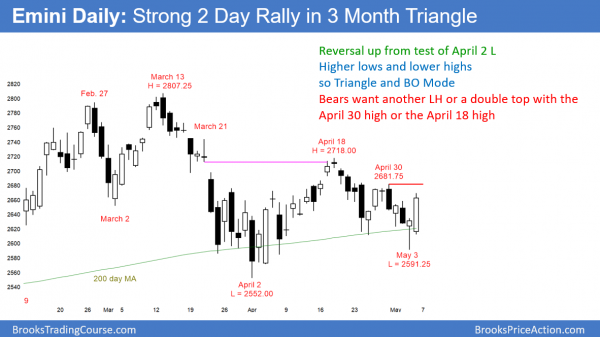
The daily S&P 500 Emini futures candlestick chart formed a big bull trend bar Friday after Thursday’s strong buy signal bar. The bulls need a strong breakout above the April 30 lower high. The bears will try to create a double top with that high.
The daily S&P 500 Emini futures candlestick chart had a big bull trend day on Friday. There was a good buy signal bar on Thursday and 2 other strong buy signal bars in the past two weeks. The odds are that the Emini is resuming its bull trend.
However, the bulls need follow-through buying next week. Without it, the odds will revert back to favoring a continuation of the 4-month trading range. In addition, a strong reversal down from either the April 18 or 30 lower highs would create a double top. That would switch the probability in favor of a bear breakout.
I have said that the monthly, weekly and daily charts are all about to resume their bull trends. They have not yet. Until there is a breakout, there is no breakout.
here have been many strong legs up and down over the past few months. That is one of the hallmarks of a trading range. As soon as you think the bulls are in control, the chart reverses down. Once you think the bears own the market, the selloff reverses up.
Strong two-day rally, but still in triangle
The daily and weekly charts are still in triangles. While the past two days were very good for the bulls, until the rally breaks strongly above one or more lower highs, the chart is still in an early bear trend. Lower highs, even in a trading range, mean that the chart is an early bear trend. Every trading range is also in a bull trend. Until there is a breakout, the odds shift back and forth in favor of the bulls or bears.
For example, if this week rallies to or even slightly above the April 30 lower high at 2681.75, but reverses down, there will be double top bear flag there. The bears can also create a double top with the April 18 lower high at 2718.00 or even the March 13 high of 2807.25. Yet, if the bulls begin to get 4 – 5 consecutive strong bull days, the odds are that the bull trend is resuming, even if the rally is not yet above the March lower high.
The bears will sell around each lower high. We do not yet know if there will be more bulls buying each breakout. Until it is clear, the bulls only have a slight advantage at the moment. But, even if the bears get a breakout to below the 20-month moving average, the odds will be that it is still in a bull flag on the monthly chart, even if there is a bear trend on the daily chart.
Watch Al Brooks discuss how to trade common patterns that form during the first hour in his talk at the TradersExpo Las Vegas here.
Traders can see the end of the day bar-by-bar price action report by signing up for free at BrooksPriceAction.com.


