

I am now looking for stocks that are boringly trading sideways during whipsaws. Calendar spreads placed after earnings are relatively safe trades, but with relatively low returns. Iron condors on the large market indices are also more attractive, says Kerry Given, PhD.
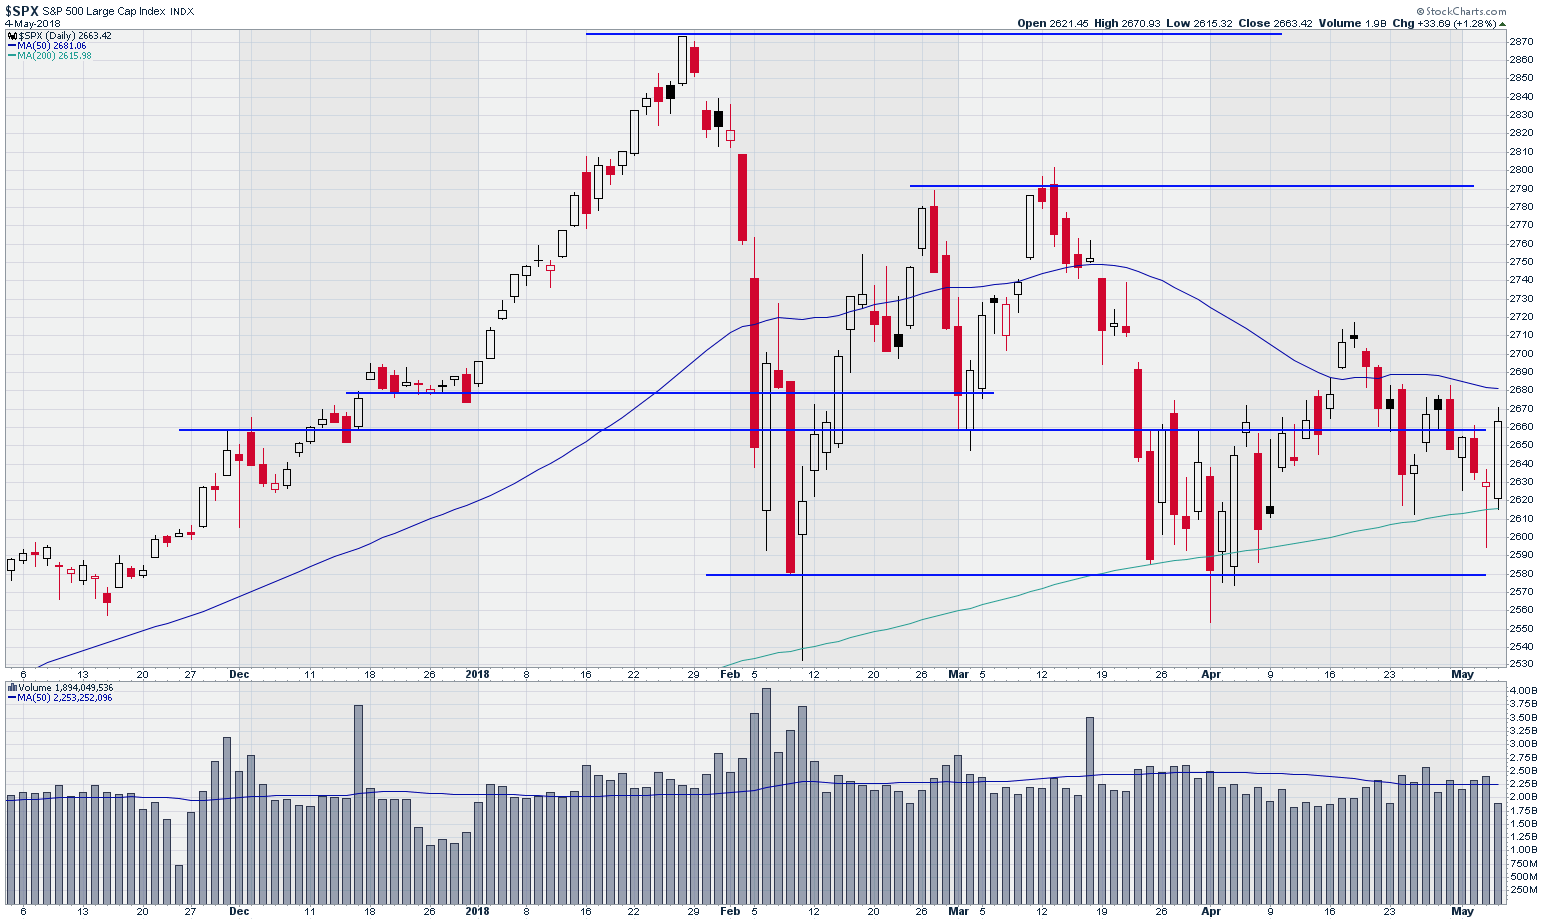
The S&P 500 Index (SPX) opened last week at 2675 and trended down all week, losing almost 2% at Thursday’s close. However, Friday’s market was a different animal, with SPX trading higher by 34 points, or 1.3%, to close at 2663. But before we break out the champagne, it is worth noting that SPX remains down nearly 1% for the year.
The year 2018 has been a rough ride. The February correction took us down by 10.2% and then the April retest of the correction was severe on its own at -7.5%.
Standard and Poor’s 500 Index (SPX)
Chart courtesy of StockCharts.com
Trading volume in the S&P 500 companies has remained relatively low since the February correction, rarely bouncing above the 50-day moving average (dma). Friday’s strong move higher was not as positive as it might have been since it occurred on volume of 1.9 billion shares, well below the 50 dma at 2.3 billion shares.
The positive news for this market has occurred over the past two weeks of trading.
SPX has traded down close to the 200 dma on four occasions, including Friday, but has managed to bounce higher each time. My rose-colored glasses were smashed earlier this year, so I don’t think I am imagining this positive signal.
The 200 dma is acting as a solid line of support. That is a strong rebuttal to all of the doom and gloom voices that are all too common these days. In fact, I have to wonder if we aren’t talking ourselves into a bearish view of the markets. This market’s squeamish behavior is inconsistent with the economic data.
The analysts at FactSet published a report last week on the occasion of 50% of the S&P 500 companies having now reported earnings for the first quarter. And 74% of those companies beat the revenue estimates of the analysts and 79% beat the earnings estimates. This is the best rate of earnings “beats” since FactSet started tracking these numbers in the third quarter of 2003.
Friday’s jobs report included a new low in the unemployment rate, down to 3.9%, the lowest since the year 2000. The unemployment rate among blacks is the lowest ever recorded.
Doesn’t that make you wonder what’s going on with this market? Have we just fallen victim to the negativity that seems so common?
Friday’s market was odd by any standard, trading much lower and breaking through the 200 dma, but then recovering nearly all of that loss before the close. SPX ranged from open to close 33 points or 1.2%.
On the Bollinger bands chart, that extreme lower push took the price outside the lower edge of the bands before recovering. Friday’s move was just as extreme, starting just above the lower edge of the Bollinger bands and ending the day above the 20 dma in the center of the bands. These are some wild swings.
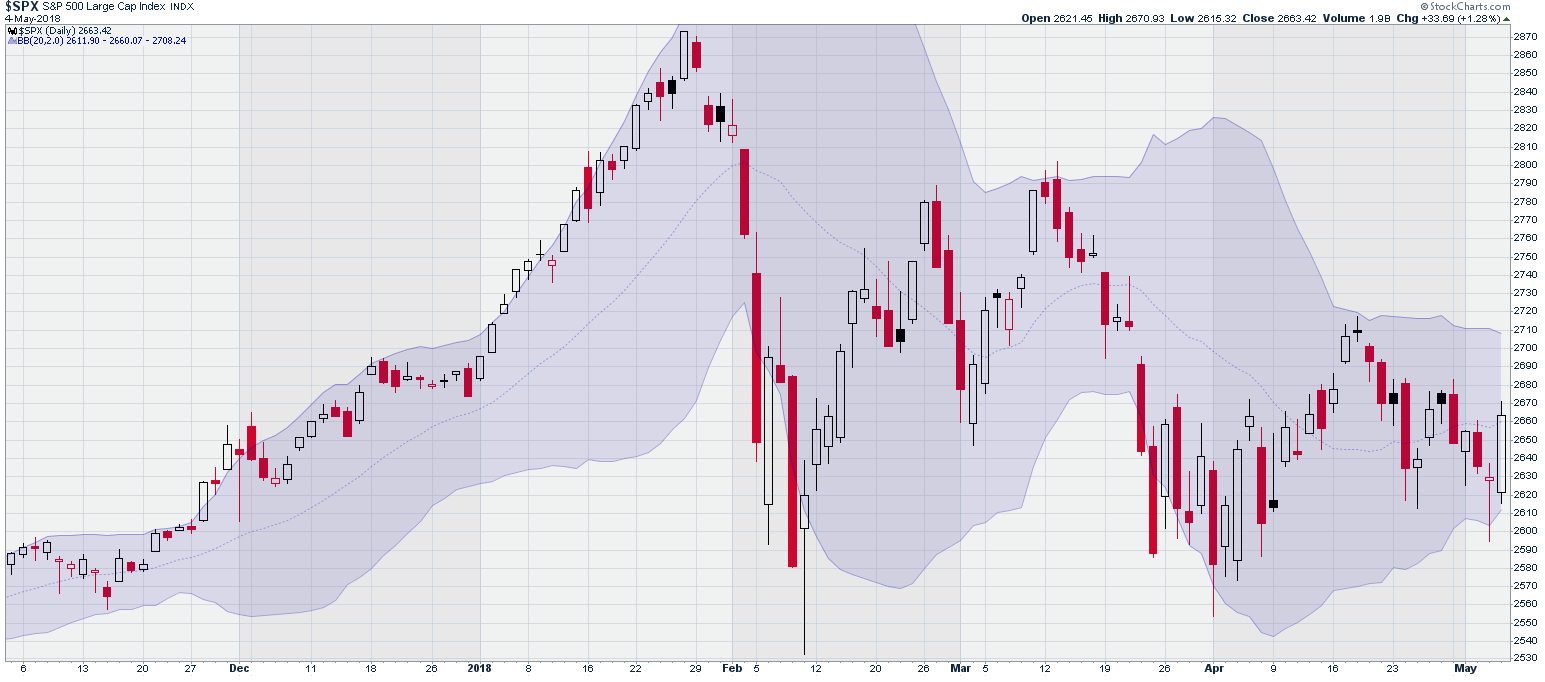
Standard and Poors 500 Index (SPX) with Bollinger Bands
Chart courtesy of StockCharts.com
The Russell 2000 Index (RUT) consists of largely domestic companies that are much smaller in capitalization than the blue chips of the S&P 500. These are the so called “risk on” stocks. Thus, it is ironic that this index has performed better than SPX all year.
The February and April corrections broke the 200 dma on SPX and SPX has been bouncing off the 200 dma for the past couple of weeks, but trading in RUT last week has been around the 50 dma, not flirting with the 200 dma. RUT closed Friday at 1566, up 19 points or 1.2%.
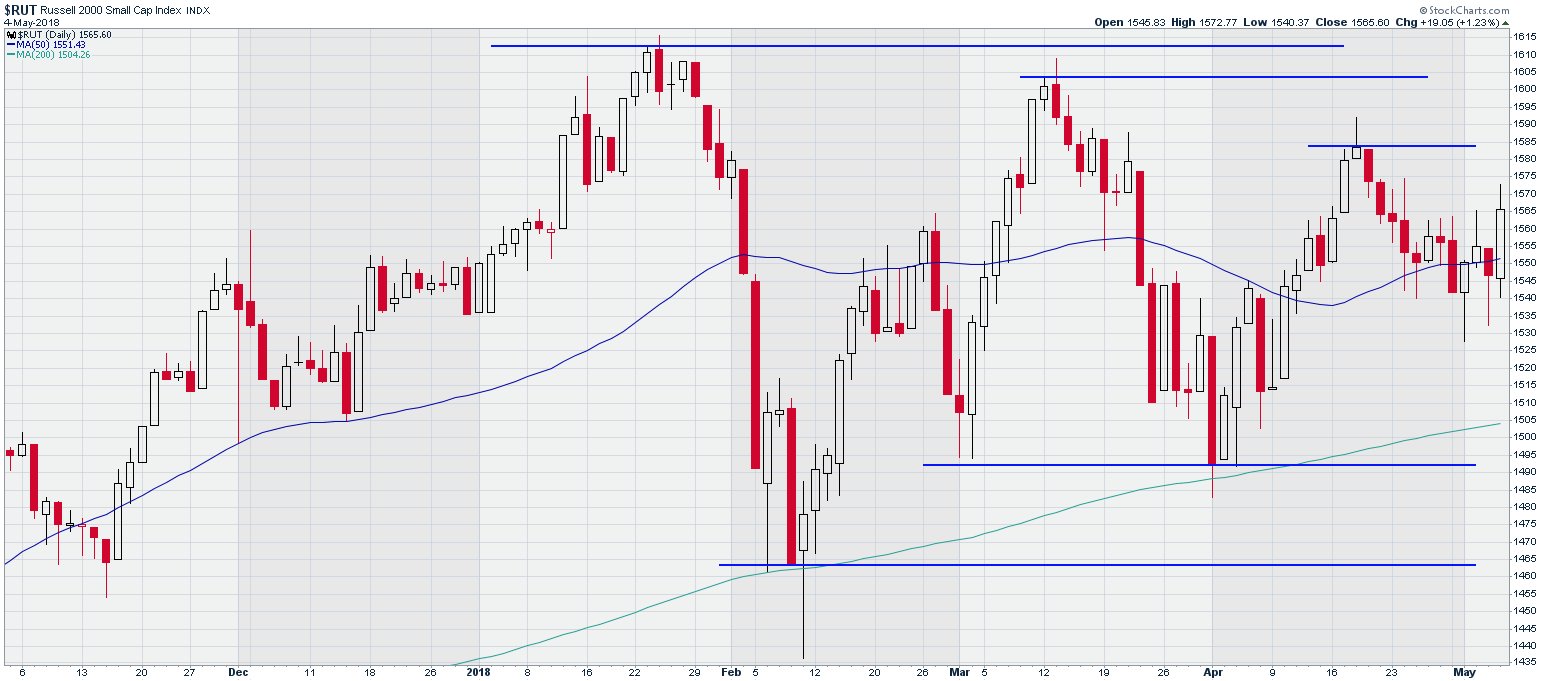
Russell 2000 Index (RUT)
Chart courtesy of StockCharts.com
The NASDAQ Composite closed at 7210 Friday, up 121 points or 1.7%. Much of that spurt was fueled by Apple (AAPL) and that price spurt was fueled by Buffett's investment in Apple. Nasdaq broke through its 50 dma Friday, but the trading
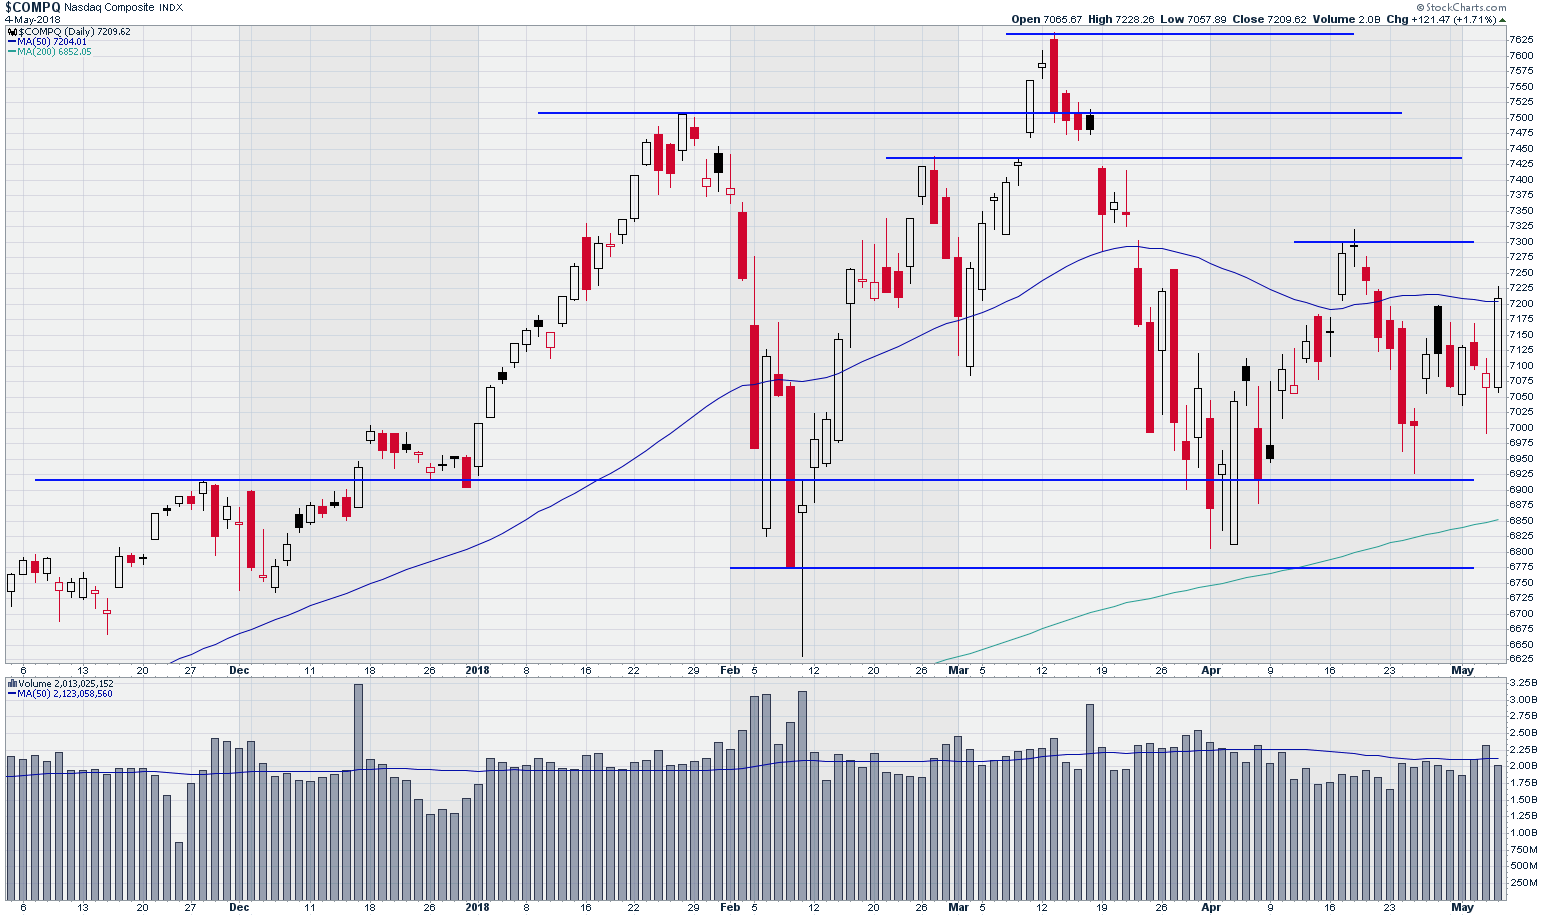
NASDAQ Composite Index
Chart courtesy of StockCharts.com
volume remained below the 50 dma.
The S&P 500 index’s volatility index (VIX) moved essentially sideways all week, running just below 16%, and closing Friday at 14.8% after hitting an intraday low of 10.9%.
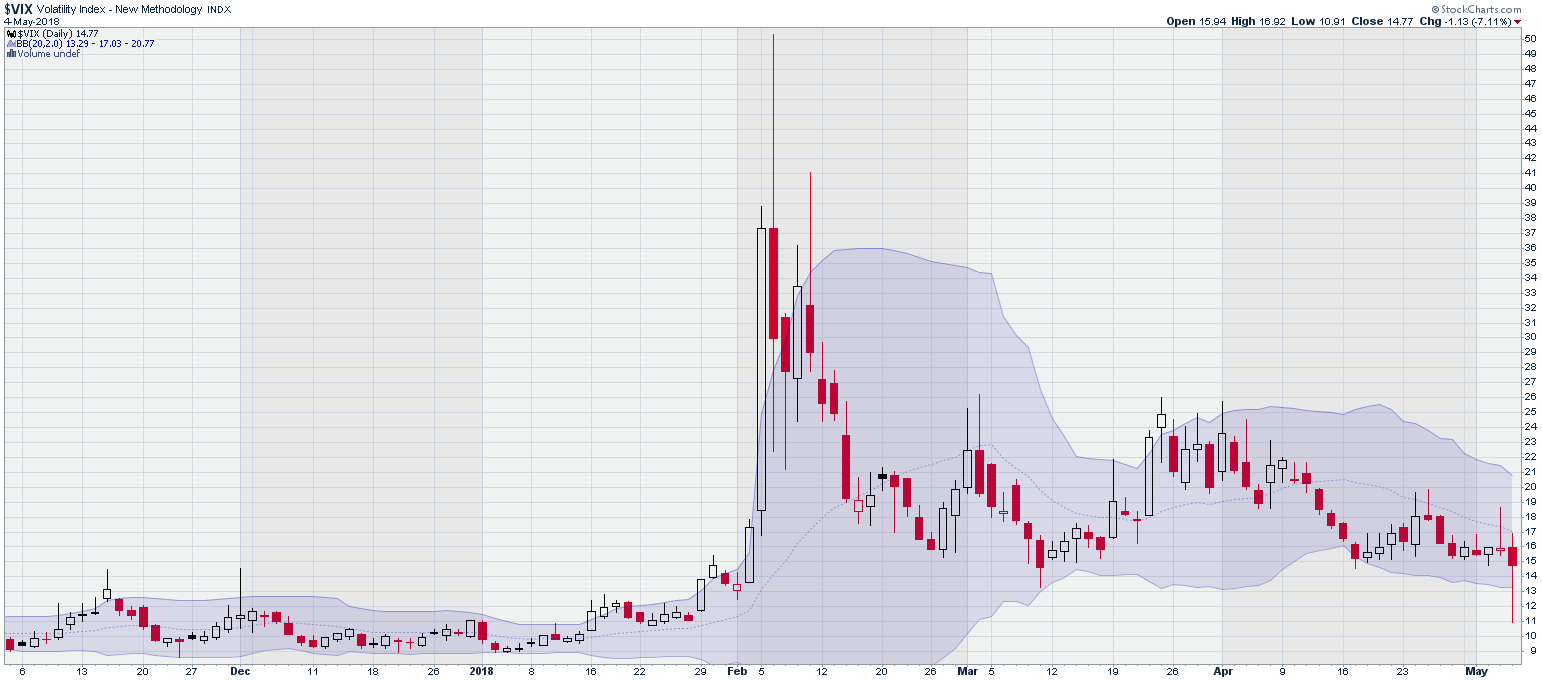
CBOE SPX Volatility Index (VIX)
Chart courtesy of StockCharts.com
Early in my market training, I was frequently told that the market is a present value calculation, so it is always looking forward and attempting to price assets on the basis of their future prospects. On that basis, it is hard to rationalize this market. We continue to see economic data and corporate earnings setting records, but it seems as though the market is preoccupied with prospects of doom and gloom at every turn.
I also learned long ago not to trade my carefully analyzed predictions in the face of a market going the other way. I may see many reasons why this market’s nervous oscillations shouldn’t be happening, but they are. It is what it is.
I have pared back on my positions. In my Conservative Income service, I have a preponderance of covered call positions on industry sector ETFs to minimize single stock risk during this earnings season.
I am now looking for stocks that are boringly trading sideways during this market’s whipsaws. Calendar spreads placed after earnings announcements on those boring stocks are relatively safe trades, but also with relatively low returns. Iron condors on the large market indices are also becoming more attractive.
Above all, manage your risk.
Kerry W. Given, Ph.D.
Parkwood Capital, LLC


