

Is the May 3/4 macro market equity swing-low over or just taking a pause, asks Ziad Jasani in video and commentary Sunday.

View my market strategy session video May 18
• As of May 14 (where we suggested looking for exits) we’ve seen a choppy sideways S&P 500 (SPX) and Global Equity Market (ACWI)
• Last week, drags presented from Emerging Markets (EEM), U.S. Technology (QQQ, XLK, IYW), U.S. Financials (XLF, KBE)
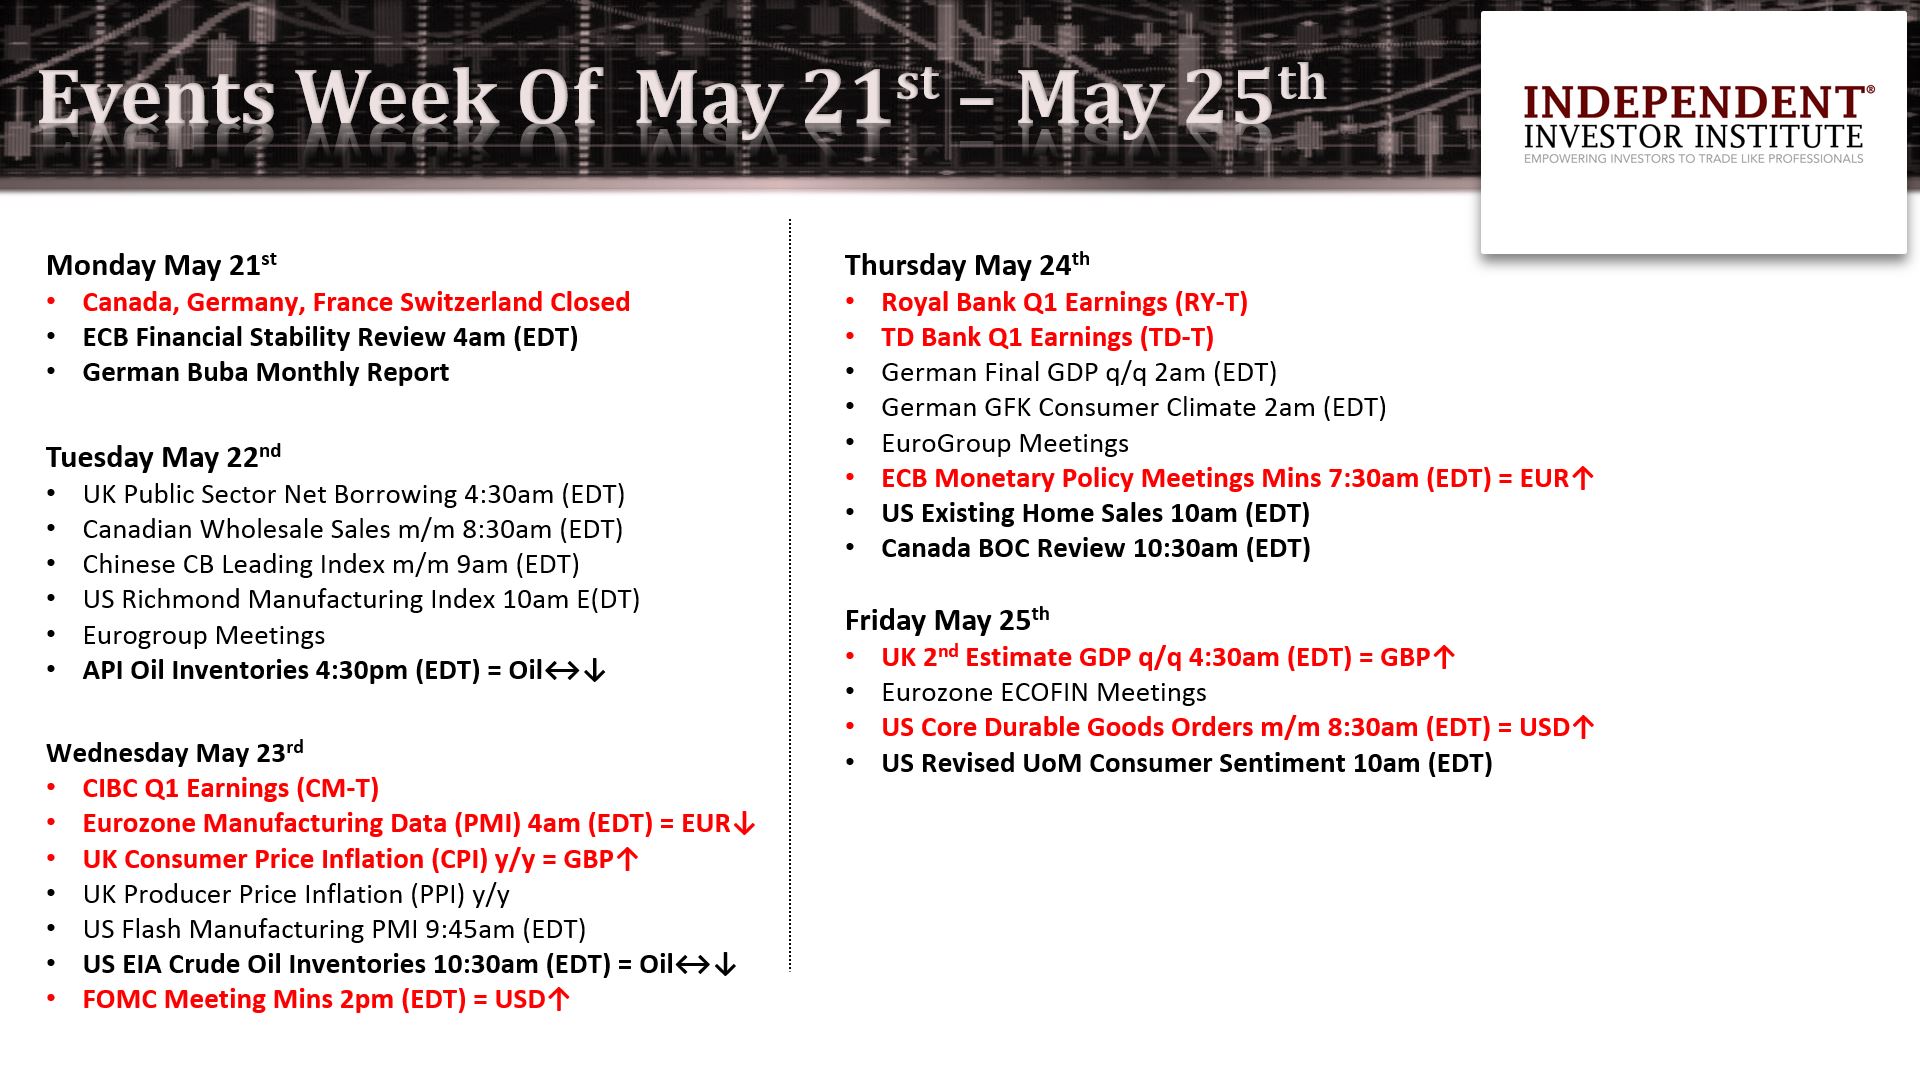
• However, the 50% correction-retracement-levels held as support (S&P 500 2,703, ACWI $73.03) and most market spaces remain above 50-day averages; furthermore the S&P 500 and Globe (ACWI) present 1 standard deviation “cheap” on annual routines.
• The S&P/TSX Composite Index (TSX) advanced above resistance of 16,095, on Oil but finds itself highly overbought, dislocated and expensive on annual routines with most of last week’s upside levered to Oil and Energy Equities (XEG-T, ZEO-T), while Financials (XFN-T, ZEB-T, ZWB-T) held up.
• Chart patterns and candle formations on the S&P 500, ACWI and TSX coupled with volatility at a level of complacency CBOE S&P Volatility Index (VIX) suggest Scenario B (Indecision) is more likely to present in the week ahead, but that doesn’t mean the May 3/4 bounce is over.
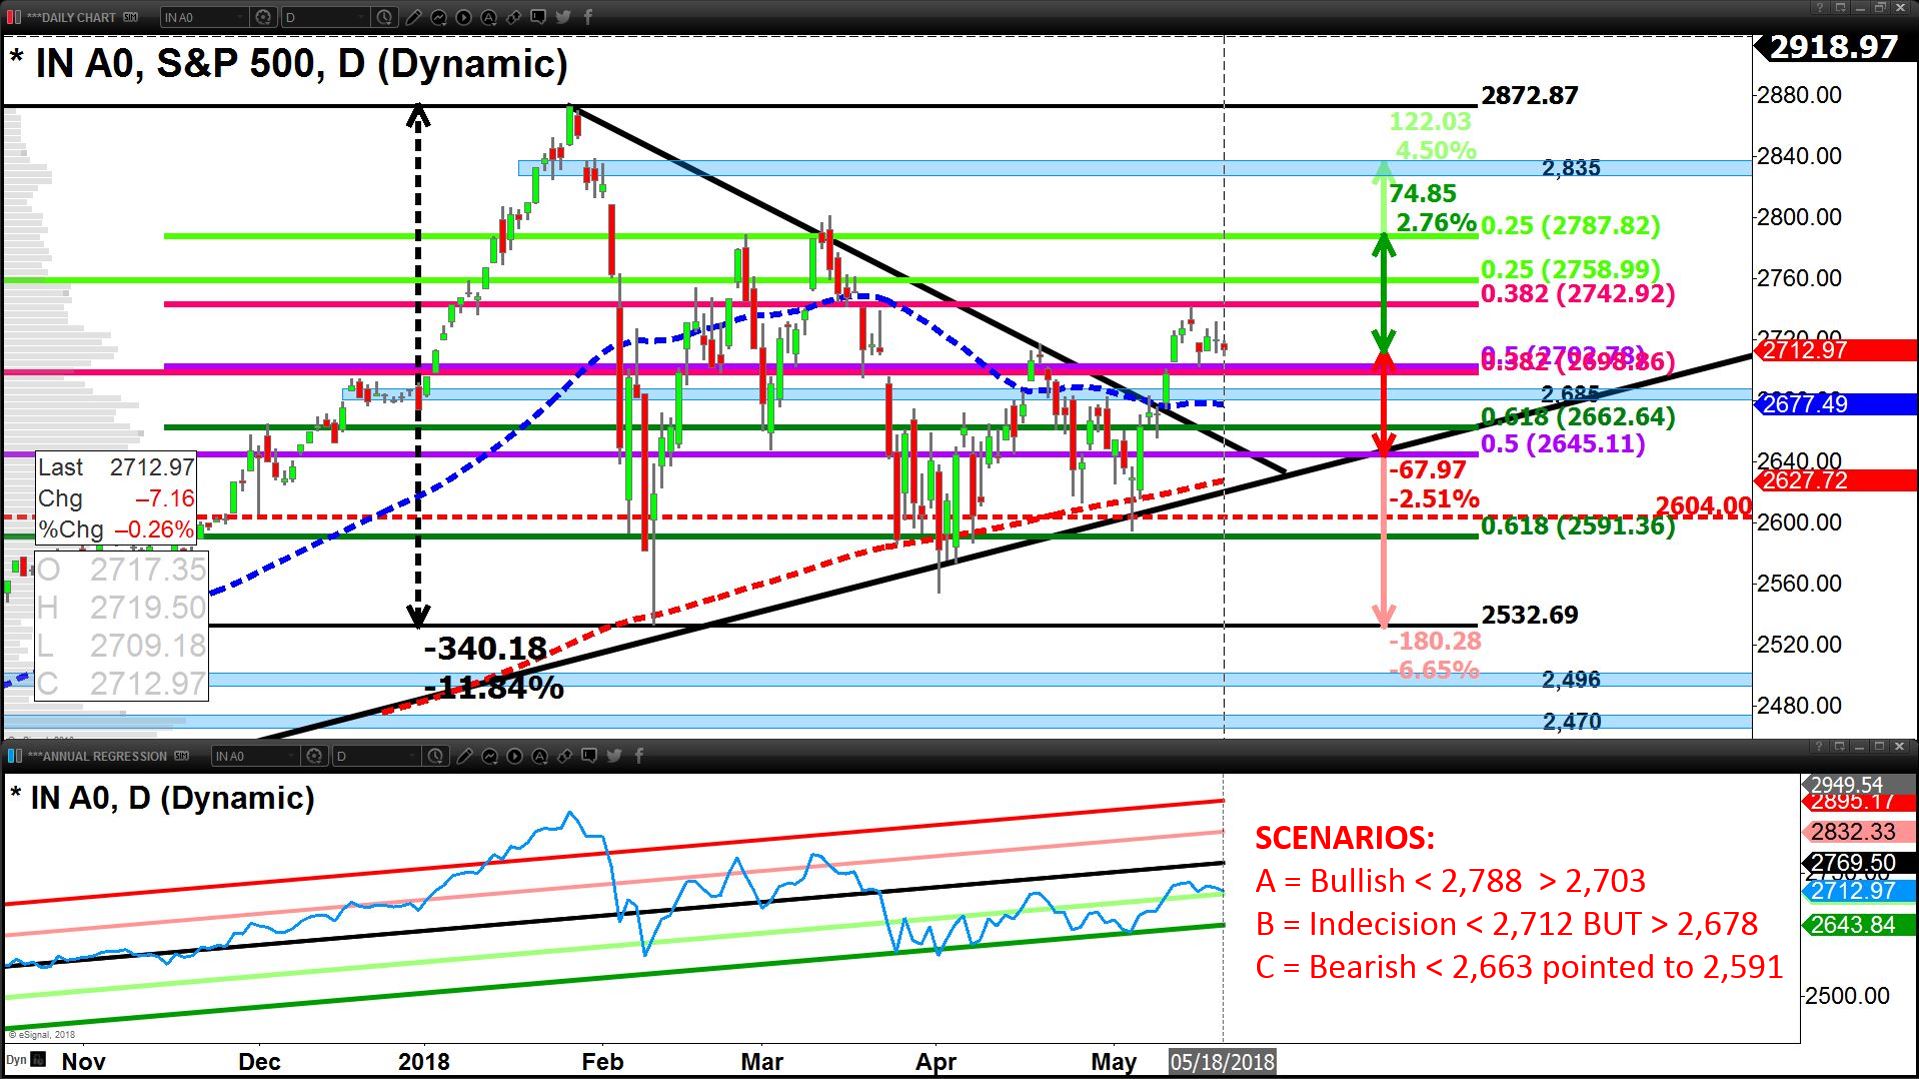
• STRATEGY: Effectively, we’re awaiting confirmation of the S&P 500 and ACWI presenting swing-low-formations above 50% retracement levels (S&P 500 2,703, ACWI $73.03) of pre-Jan. 2018 correction highs to Feb 9 lows (Scenario A).
Or we move into Scenario B and await a swing-low > 50-day average on the S&P 500 (2,678) and > 15,775 on the TSX. In conjunction with confirmation of Equities in swing-low formation, a cooling of the USD and US Treasury yields would open up acquisitions opportunities in the following markets/spaces:
• Equity Markets long: SPY, DIA, ZDJ-T, EEM, XEM-T, ZEM-T, EPI, EWZ
• Equity Sectors long: XLV, XPH, XBI, XLB, XLI, VNQ, XLRE, XLU
• Precious Metals/Miners: CGL-T, GLD, UGLD, SLV, USLV, XGD-T, GDX
• Base Metals: DBB
• Currencies: UDN (Short-USD), FXE, FXF, FXY, FXB, FXC, FXA
• Bonds: TLT, LQD, EMB
• Short-Oil: HOD-T
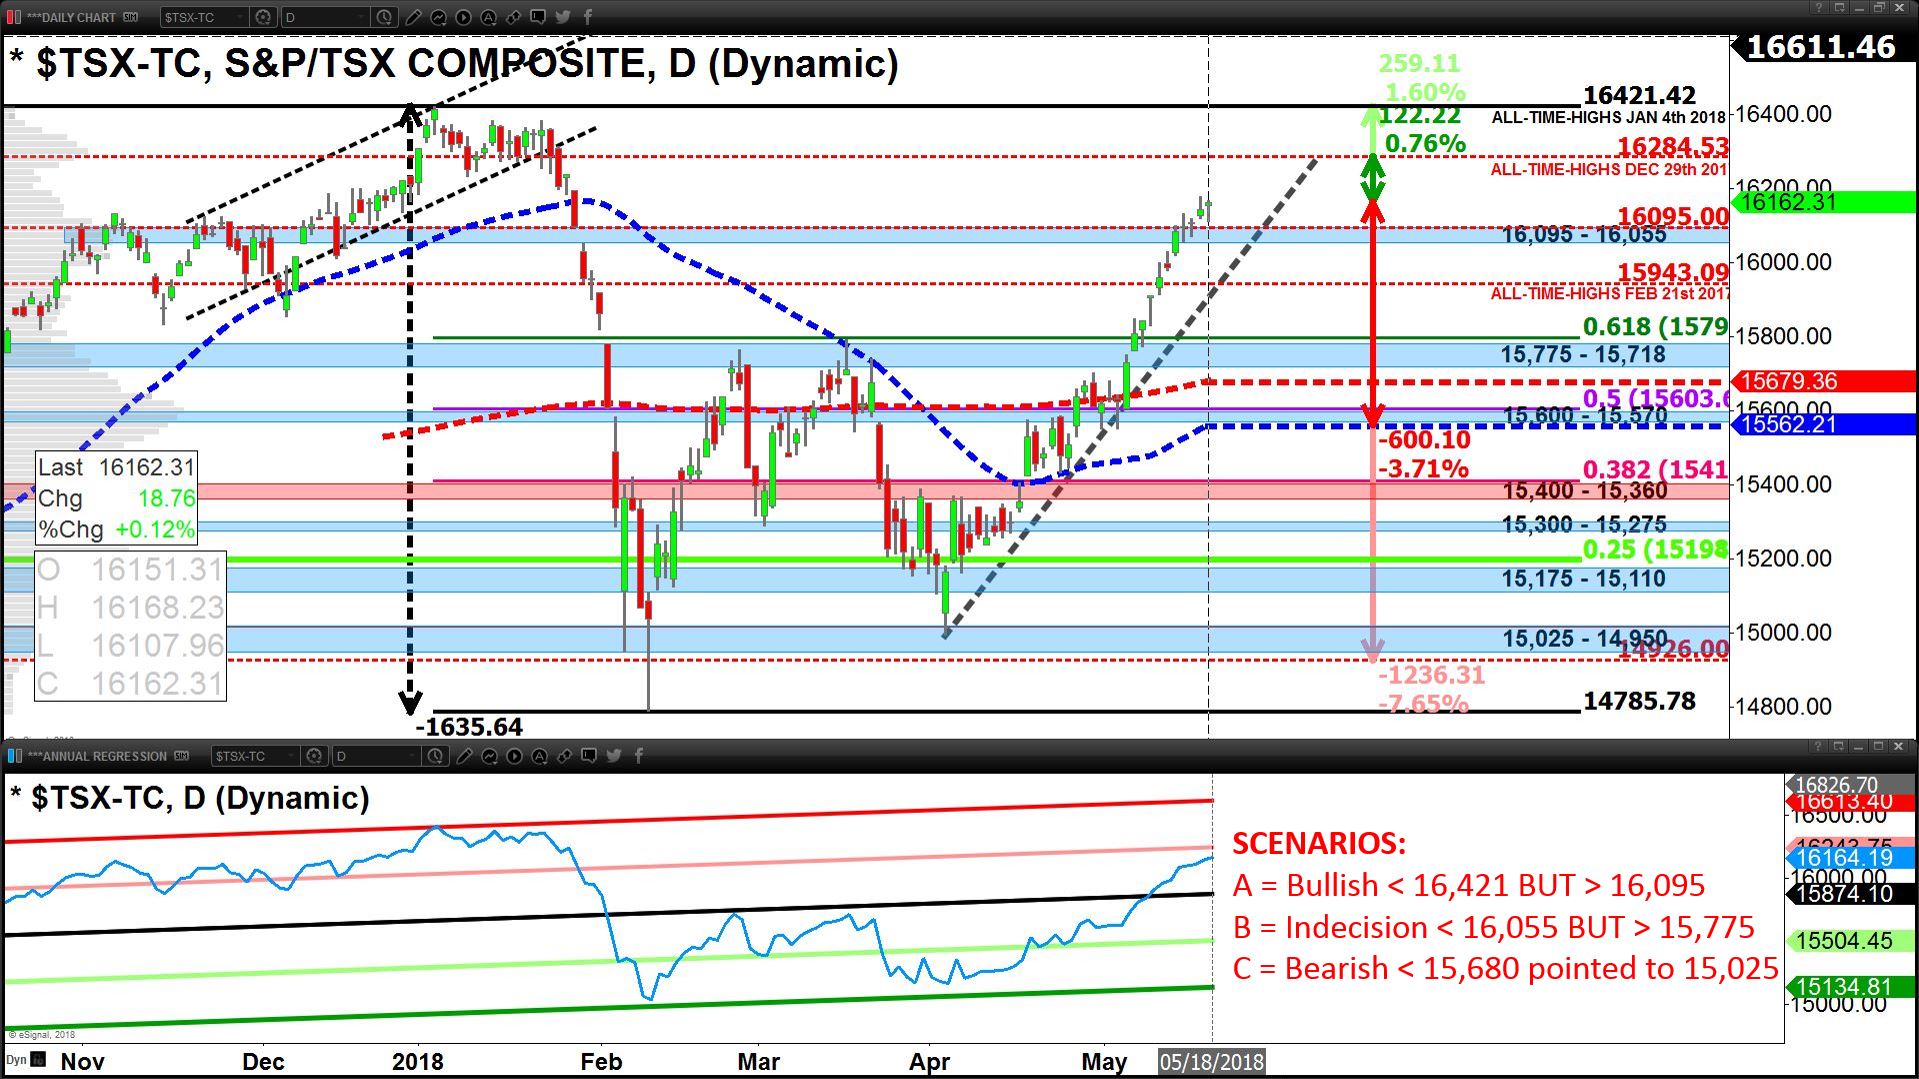
• TSX: We’re expecting a cooling-off of Oil (tilted towards ~$69.50) tied to a weakening of the USD (currently 80% positive correlation 30-day-basis), coupled with U.S. & Canadian bond yields tilted down further flattening the yield curve.
The net effect is likely to create under-performance in Energy (XEG-T) and Financials (XFN-T) and keep the overall TSX under-performing the S&P 500 at minimum until Wednesday, May 23 ahead of Canadian bank earnings.
As such we are recommending remaining in defense mode with respect to short-to-mid-term swings and longer-term holdings within the TSX; even if the S&P 500 is able to confirm a swing-low formation early in the week.
If the Oil cooling is orderly and CM, RY & TD delight on earnings, we may be able to accumulate XFN-T, ZEB-T, ZWB-T, XIC-T, XIU-T May 23 onwards.
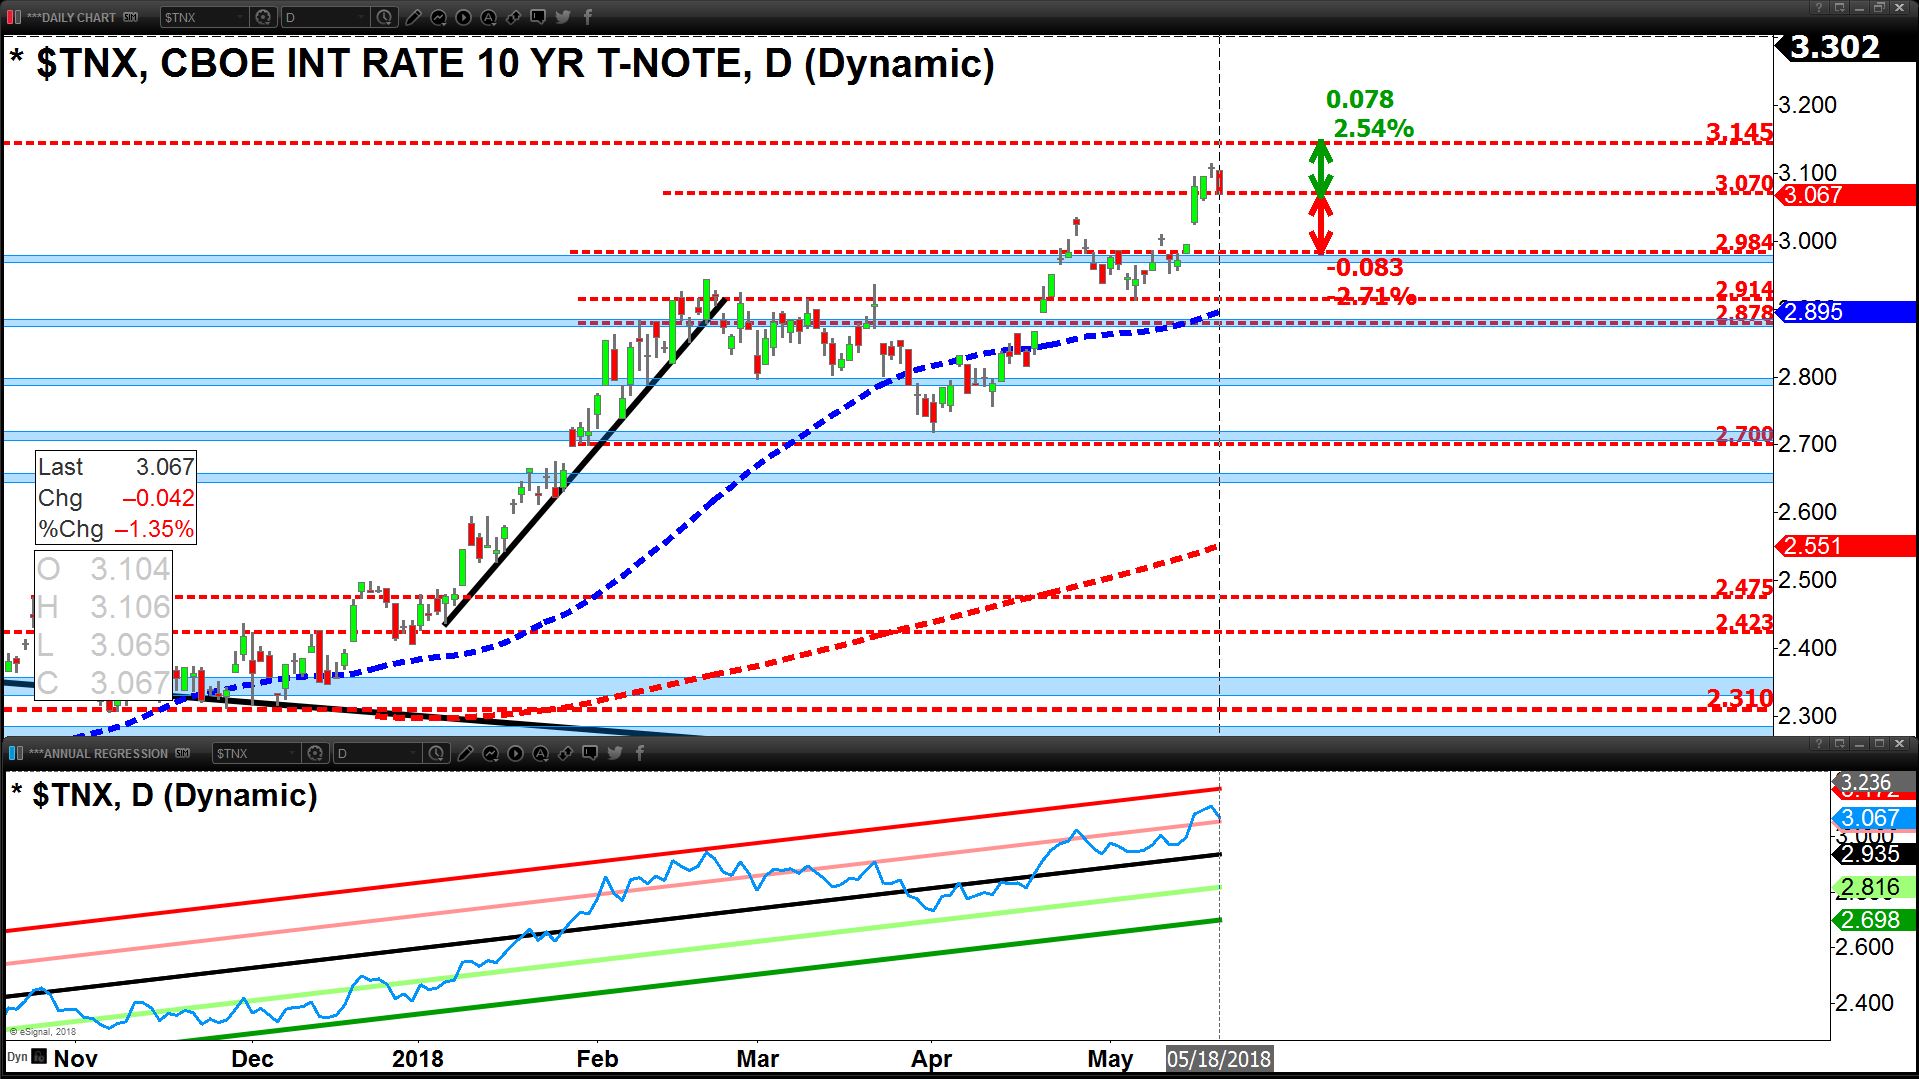
• CURRENCIES – BONDS – YIELDS – PRECIOUS METALS: Polarizing conditions present in the short-term (USD expensive/overbought - euro cheap/oversold).
Expecting a bounce in the euro and cooling off on the USD, coupled with softening of US Treasury yields; in market behavior on Friday, May 18 supportive and encouraging to a softening of U.S. & Canadian yields into the week ahead.
Based on 30-day correlations the aforementioned supports looking short Oil (HOD-T) and long Precious-Metals (Gold, Silver) and Bonds (TLT) for a quick bounce.
NAFTA issues and weaker Canadian retail sales coupled with an in-line presentation of CPI data (May 18) suggest the CAD may soften further, nearing 1.295 to 1.30 early in the week ahead but a transition to strength into week’s end is expected ~1.285 or lower.
View the Independent Investor Institute trading ideas and strategies videos here.


