

A whirl around the markets: lumber up, and so is crude. China trade tensions, of course. The equities buyback game. How fixed-income is faring. And our weekly CryptoCorner Index, writes Nell Sloane.
Trump ignores jobs embargo: The U.S. Labor Department reported the economy added 223,000 jobs in May, which was higher than the forecast amount of 190,000. The unemployment rate fell to 3.8%, the lowest since 1969. Even hourly earnings rose to annual rate of 2.7%. The WSJ reported that Trump tweeted “looking forward” to the jobs report about an hour before the release, but can POTUS be held to the embargo rule? We doubt it, but the tweet caused an early jump in yields as traders anticipated a better-than-expected number based upon the tweet.
**
Volcker 2.0: The Fed reported on upcoming changes with Volcker 2.0. The WSJ reports that the prohibition on prop trading by banks would continue, but less stringent and more simplified enforcement for the rule would give bank managers more flexibility toward trader behavior.
**
Crude shock: Just tossing this tidbit out and despite the recent pull back in Crude, we went to the gas station recently in Chicago and unleaded gas, the premium version was $4.30! How’s that for summer driving budgets? Is there a difference in 87 or 93 octanes? Probably, but I bet most will forgo the more expensive premium and buy the 87 version! Somehow, we tend to feel that the price of oil is manipulated, but that’s just us!
**
A lumber high: The WSJ also had a great article on the price of lumber today. One thing of note there, Lumber hit a high on May 17 at $639 and as of yesterday closed at $589, down nearly 8%. Is this significant? Can we correlate the price of Lumber in leading the way to another down leg in housing? It peaked in early 2005 as well, so this should be interesting? A break of this 8% threshold may see some CTA trend followers hop on board.
**
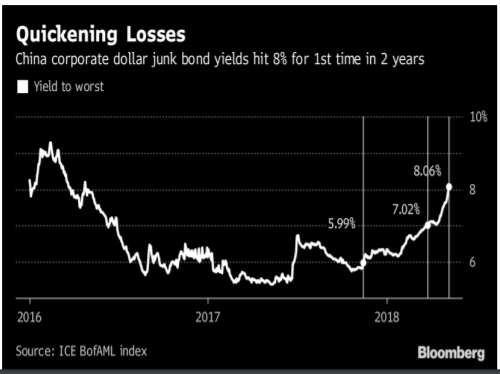
China relies on exports: We also continue to see political posturing due to the heightened trade tensions, especially with China. China proposed a $70 billion deal to purchase farm, manufacturing and energy products. The Trump administration wants to see upwards of $375 billion in trade deficit reduction and what it seems like to us, is that Trump is a master negotiator and will most likely get his way. After all, negotiations are about posturing from the position of power and considering China is fully reliant on exports and considering their growing leverage, we tend to think the U.S. holds the power. We also came across this chart from Bloomberg, which clearly demonstrates growing Chinese corporate debt and interest costs!
**
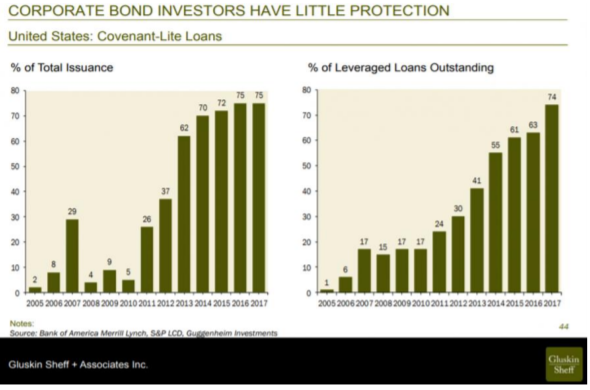
Borderline insanity loans: However, we can’t just extend and pretend and think the United States is immune. It seems as if every government and every corporation has sold everyone down this unicorn like path of debt and interest. Loans are all that is necessary to spur growth, right? Well as this next chart from Gluskin-Sheff shows, the percentage of leveraged loans outstanding is borderline insanity, but then again, who’s looking?
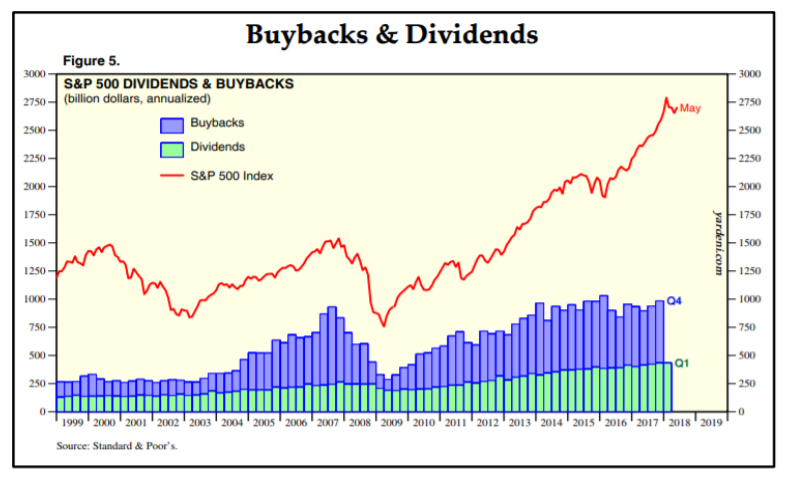
All that aside, we continue to hear that many are confused of the CBOE S&P Volatility Index (VIX) moving back down, of the stock markets being resilient, but in reality we aren’t sure why there is confusion. When you continue QE, when you continue shares outstanding buy backs, what do you expect?
Yardeni Research gives us two charts that provide an excellent visual analysis of why equities do not fall very far:
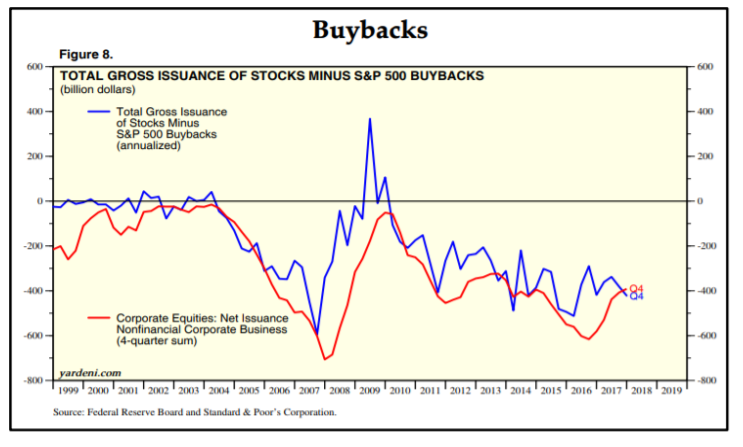
When Yardeni digs in deeper we can see that total gross issuance when adding buybacks is a net loss of $400 billion worth. So, it’s simple math, when you reduce the supply of shares outstanding it’s like the reversal of debasement. This game can go on as long as the supply of interest rates doesn’t exceed the capacity to repay said interest rate!
When will that be, is anyone’s guess, we would rather not be made fools for even attempting such a feat!
**
We’re heard this equities story before: So, from a fundamental monetary and equity market mechanism point, equities are indeed artificially supported both by monetary largesse as well as the financialization of virtually every corporate treasurer on the planet. Why invest in people or capital when you can arbitrage interest rates from such a willing supply of capital from QE driven central banks?
You wouldn’t and so they don’t. It’s rinse, recycle, repeat and it’s been going on for decades. People often ask, well isn’t there a limit, isn’t there some imbalance that can bring all of this artificial support down? The answer is a resounding yes, and that is when people finally wake up and realize that the “value” that they are being sold only works if you participate.
What do we mean? We mean you are either in the fiat game of debt induced and future valuation brought forward regime, or you are not. You are either the 17% who actually hold stocks, or you are not. If you don’t play, you don’t get paid, period. It doesn’t matter where you get in, they say, rather, it’s that you are merely just involved. Yeah, well we have heard this story before and it all ends the same way.
Anyway, trade wars can also bring pressure down on this system, protectionism is bad for this system and its why the push globalism so much.
Remember fine Americans, it’s a zero-sum game. This is especially true in the game of standard of living. What one country gains, another loses, thus the balance and thus America is going to find out soon, whether the rest of the world needs them or they need us.
This certainly wasn’t what the Democratic globalist party wanted to see and its why their loss in the 2016 election was so devastating. Basically, their global dominating plans were all tossed into the dust bin of history and all those data peddling, non-privacy concerning entities are all crapping a brick right now wondering when the day of reckoning is coming on their holy grail source of power, known as data selling.
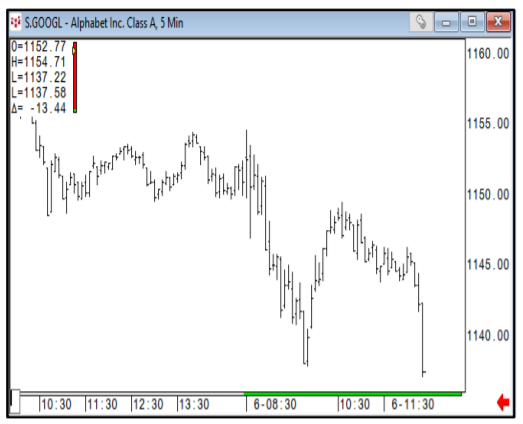
Actually, Google (GOOG) stock took a hit as the EU unveiled some potential negative findings in their ongoing probe of the firm.
Here is a chart of their action earlier today. Google sits around $800 billion in market cap, but we suspect all these broke governments are going to look for those that have profited the most over the last few years and we all know who those FAANGs are, don’t we…
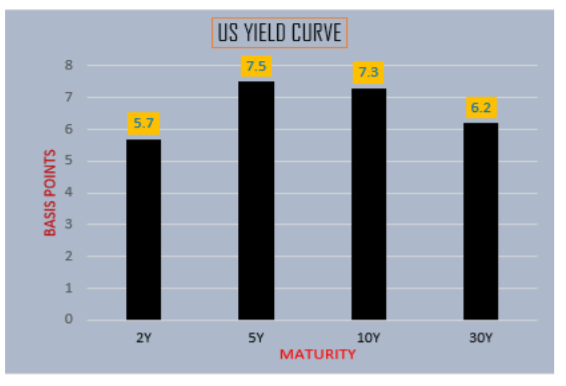
Fixed-income market: We can tell that the fixed income market didn’t like the higher employment report as yields spiked across the board a week ago. The 5-year sector took the biggest hit with a 7.5 basis point flattening which pushed the 5-year yield back up to 2.74%. The 10-year wasn’t too far behind as it lost 7.3 basis points to close the day at 2.897%.
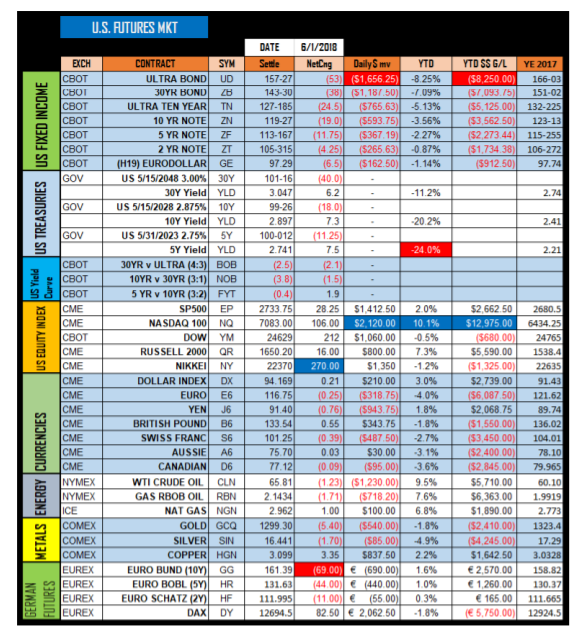
As far as the other markets go fixed income being the obvious losers on the day, the equity markets were led by none other than the Nikkei which was up some 270 points. The Nasdaq continues to shine and posted a huge 106 handle gain, putting it up 10% on the year and the obvious stand out of the year. Oil was leading but that has given up ground over the last week or so and continued its drift losing $1.23 to close at $65.81. The U.S. dollar saw some strength as the yen lost 76 ticks to close at 91.40, while the euro treads water at 116.75.
We have attached our new daily settle sheet with the markets we follow and we hope this gives you a good overview of the things we like to keep a close eye upon:
**
Moving over to the crypto currency land, which hasn’t really done much over the last few weeks. Bitcoin (BTC-USD) has been very steady, hovering around the $7500 level, which we view as significant toward developing a nice horizontal base. This sideways action should provide both stability in the overall volatility of bitcoin as well as a general new direction when the market does break in either direction.
EOS (EOS) has backed off its highs and trades down toward some decent support in the $12 area.
Ethereum (ETH-USD) has also run into decent support and we expect the high $500s to be formidable support. We are glad to see these markets calming down as we are long haul positive players and we view this type of sideways action as necessary for long term viability and sustainability. Here is a snapshot of the Crypto settles as of Friday June 1, 2018:
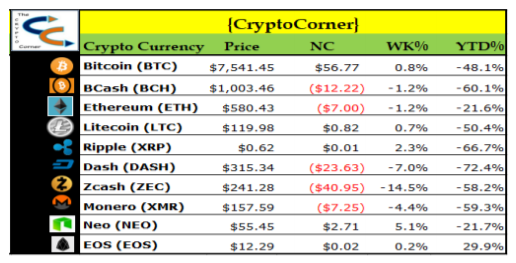
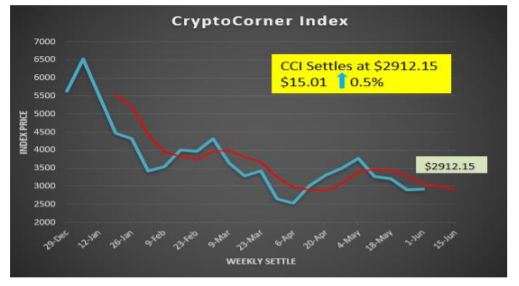
Our Crypto Corner Index was up a meager $15.01 and we are waiting for a close above our moving average in order to provide a more bullish stance.
Anyway, thanks for reading, summer is here, stay thirsty my friends, Cheers!
Nell
Subscribe to Nell Sloane's free Unique Insights and Crypto Corner newsletters here
More articles on cryptocurrencies on MoneyShow.com
The CFTC and virtual currencies
CFTC warns about currency pump-and-dump schemes
Don't trust Buffett, Gates on bitcoin. CryptoCorner Index up 7% on the week
CryptoCorner Index shows consolidation. A dozen crypto trends you should know
Trading Lesson: Confessions of a crypto analyist who ignored sentiment
The risks and rewards of trading cryptocurrencies
Trading Lesson: Decrypting the cryptic cryptos
Trading Lesson: Decrypting the cryptic cryptos: Many questions, few answers
Trading Lesson: How I learned cryptos and became the Ethereum Whisperer
Trading Lesson: Are you still fearful of cryptos?
Trading Lesson: A bottom in the crypto market, or more blood-letting?
As regulators come for crypto criminals, invest in what is real


