

The odds still favor the bulls. A bull breakout above the five-month trading range projects to around 3,100. If there is a bull breakout, which is likely, the top will probably be between 3,000 and 3,200, writes Al Brooks over the weekend.
Monthly S&P 500 Emini futures candlestick chart:
Breakout above 3-month bull flag
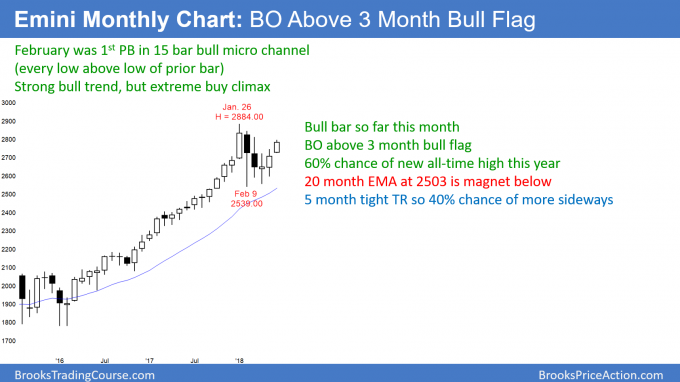
The candlestick on the monthly S&P 500 Emini futures chart is a strong bull bar so far this month. It is the second month of a breakout above a three-month bull flag.
The monthly S&P 500 Emini futures candlestick chart is breaking above a three-month bull flag. Since the chart has been sideways for five months, it might continue sideways for several more months. However, whether or not it does, the odds favor a new all-time high this year. The rally will probably continue to above the 3,000 Big Round Number.
The bears always have an argument, even though it is not strong at the moment. The month is only half over and therefore the chart might look very different in a couple of weeks. For example, if the Emini sells off from here, the month could end up as a bear reversal bar and a lower high.
But, even if that were to happen, the odds would favor more sideways trading instead of a bear trend. The bull trend is strong, and the bulls will probably get a new all-time high this year.
Weekly S&P 500 Emini futures candlestick chart:
Weak sell signal bar
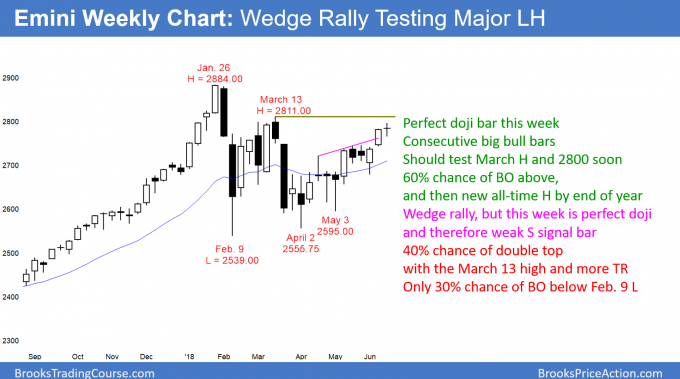
The weekly S&P 500 Emini futures candlestick chart had a small, perfect doji last week. The bears want a reversal down from a wedge rally. They also see this as a lower high double top with the March high. However, the week is a small bar and therefore a weak sell signal bar, especially since the two-month bull channel is tight. Furthermore, there is still room to the resistance of the March high and the 2800 Big Round Number above.
The weekly S&P 500 Emini futures candlestick chart has been in a weak bull trend since the May 3 low. The bears want a reversal down next week. The 11-week rally has had three pushes up in a tight bull channel. It is therefore a parabolic wedge. In addition, a reversal down from here would be a double top lower high major trend reversal with the March high.
This is a reasonable sell setup, but after two strong weeks up, last week’s small bar is a low probability sell signal. The bears will probably need at least a micro double top. If they get it, or if they get a strong reversal down this week, they will have a 40% chance of a swing down for a month or more. Furthermore, they would have a 30% chance of a break below the February low. The March low is the neck line of the double top. A break below projects to a measured move down to around 2300.
Double tops are created by trapped bulls
Markets have memory. Traders who bought at the March 13 high discovered that they bought badly. They are trapped bulls and are hoping for an opportunity to sell out of their longs without a loss. There are always bears selling as well. Finally, the bulls who bought near the bottom see the resistance and have a big profit. They will sell to take some of that profit.
No one knows if there are more buyers or sellers here. However, when a market approaches a prior high, it usually pauses as the trapped bulls sell out of their longs and the bulls who bought well take some profits. If there are enough new bulls willing to buy at the top of the range, there will be a successful breakout.
Since the weekly chart was in a strong bull trend prior to this six-month trading range, the odds are that the bulls will return, overpower the bears, and get a rally to a new high. This is true even if the market goes sideways to down for a couple months.
Daily S&P500 Emini futures candlestick chart:
Emini buy climax just below 2800 resistance
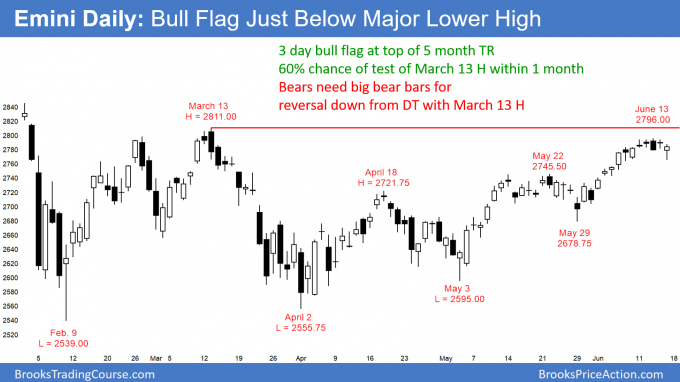
The daily S&P 500 Emini futures candlestick chart rallied strongly for the past three weeks. However, this buy climax stalled last week just at the top of the five-month trading range, just below the March high and the 2800 Big Round Number.
The daily S&P 500 Emini futures candlestick chart formed a tight trading range this week. Its three-week rally is the third leg up from the March low. Therefore, the bull channel is a wedge. However, the shape is bad, and the third leg up is strong. Hence, if there is a selloff this week, it will probably be a minor reversal and not a bear trend. The odds favor at least one more small leg up.
Because the daily chart has been in a trading range since February, pullbacks can be deep and last several weeks. The pullbacks from the March 13 high, the April 18 high, and the May 14 high are examples. Bulls who are swing trading need a stop below the most recent major higher low, which is the May 3 low. The May 29 higher low is minor. That means if the Emini breaks below it, the bull channel up from the April 2 low is still in effect. The Emini would still be in a trading range and a bull channel, and not in a bear trend.
Bears will sell at the March 13 high
There is a 60% chance of a breakout to a new all-time high this year because the monthly chart is in a strong bull trend. However, this five-month trading range could continue for many more months. In fact, there is a 40% chance that it could last all year.
The bulls had a two-legged rally from the April 2 low to May 22. Instead of selling off, they got a breakout above this top. The three-week breakout is strong enough for at least a small second leg up. Therefore, the daily chart will probably test the March 13 high within a few weeks. However, that would be a second two-legged rally, which is a possible consecutive top (a Low 4 sell signal). If the bulls are unable to break strongly above the March 13 high, they will give up. The bears would then probably get a 1 – 2 month bear leg in the six-month trading range.
Traders need to carefully watch how the candlesticks look over the next couple of weeks. If the bulls get a series of bull trend bars, especially big bars, they will likely get a successful breakout soon. Alternatively, if every bull bar is followed by bear a bar, and many bars have tails on top, the odds are that this rally will end. The bears would then take control for 1 – 3 months and the trading range will continue.
For traders to conclude that the Emini has entered a bear trend and not just a bear leg in the five-month trading range, the bears need a strong break below the February low. It is common for a bear trend to become clear only after it is already about half over. This would be an example.


