

U.S. markets (except the Dow DIA) present as the most relatively expensive while Emerging Markets (EEM), and the Eurozone Far East & Australasia (EFA) present as cheap (on annual routines), writes Ziad Jasani.
View my Market Strategy Session
Recorded: June 25, 11 am EDT
Duration: 1 hour
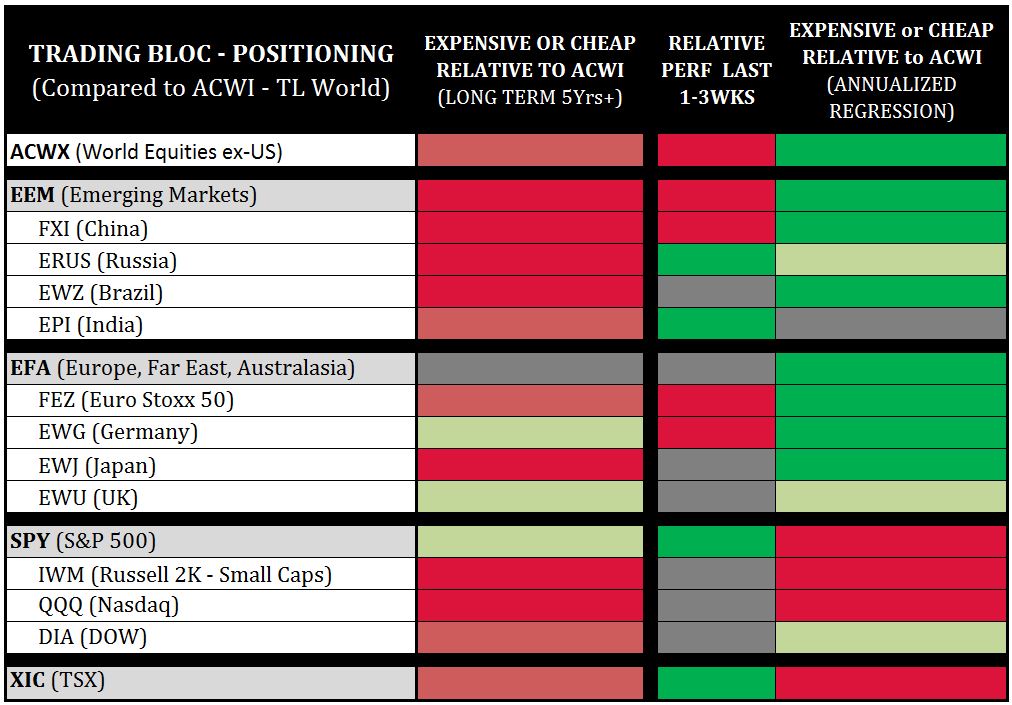
Trading Bloc Positioning
This chart compares major trading blocs back to the entire global equity market (ACWI), to determine which spaces are relatively cheaper or more expensive.
Why? Capital flows usually tilt towards relatively cheaper spaces, especially if a macro market swing-low formation takes hold.
The TSX presents as 2 standard deviations expensive, which implies the S&P 500/Toronto (TSX) is likely to under-pace the world on the way up and/or move faster down.
Since the late-January 2018 correction we are in “full swing-trading mode” with our short-to-mid-term capital and remain Hold with our longer-term holdings, while the S&P 500 (SPX) remains above its 200-day average.
To learn more about investing and trading within the cannabis space for the back-half of 2018, join us for a complimentary 3-hour Online Workshop on July 14, 2018 (12 pm – 3 pm EDT). Click here to reserve your seat.


