

All anyone can do is stick with what works and see how things play out. What’s working is what’s been working for months: Trading small lots, using options, hedging the overall portfolio, and sticking with basic technical analysis tools, writes Dr. Joe Duarte Sunday.
A familiar price pattern may be repeating itself. I am referring to the general up trend in the stock market evident since the 2016 election. And if there is no change in the pattern, we may see yet another new high in the NYAD in the next few weeks and possibly the major indexes in before the onset of yet another scary selling spree.
Indeed, it always seems darkest before the dawn, and the stock market’s main function is to make fools out of all of us. Thus, as the fear gauges spike and the world seems to be teetering on the edge of madness, it would not be surprising to see a fairly robust move to the upside in the next few weeks.
I am basing this contrarian opinion on three factors:
1) Stocks are short term oversold and credible support levels are being tested.
2) The amount of bearish sentiment has risen dramatically as low volume robot trading has jerked the market around and geopolitical and domestic tensions rise.
3) We’ve seen this all before and the robots buy every single dip.
The market is a coiled spring
Even if the major indexes are stuck in trading ranges, the most accurate indicator of the stock market’s trend since the November 2016 bottom, the New York Stock Exchange Advance Decline line (NYAD) remains in an uptrend and is signaling that a big move for stocks may be on its way.
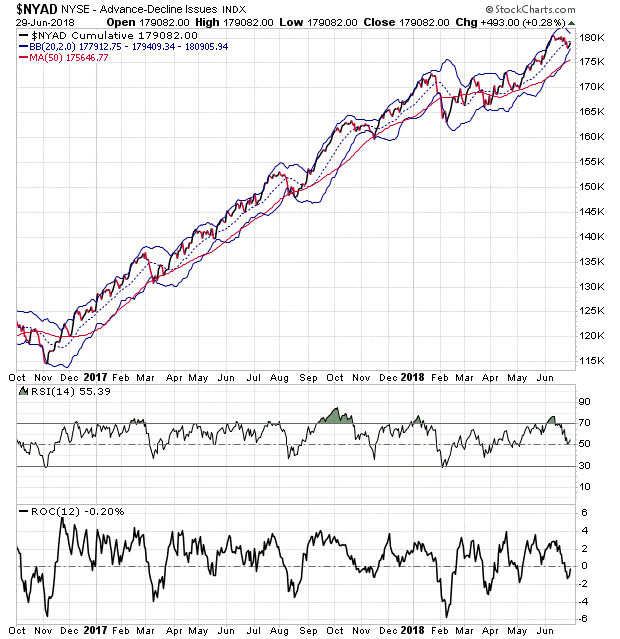
Specifically, note the constriction of the Bollinger Bands (bands around NYAD) after the AD line tagged the lower Bollinger band last week.
First, review the action in NYAD since November 2016 which shows 10 instances where the line has touched the lower band. In eight of 10 cases, the first tag of the lower band led to a market reversal and a move toward the upper Bollinger Band. The two exceptions came in August 2017 and February 2018 where a second tag of the line quickly followed the first tag before the move toward higher ground began. It is important to note that the second tag and reversal came after a further rise in bearish sentiment.
Each of the 10 instances in which this phenomenon occurred, including the current one came after overbought or nearly overbought readings in RSI led to a reversal at the top of the trading range and at least a breach of the zero line in ROC just prior to the return to the uptrend.
More specifically, when the NYAD tags the upper Bollinger Band, it signals that the market has moved up long enough and needs a rest. The reverse is also true, which is why the current configuration of the NYAD, the RSI, and ROC are encouraging, although there may still be some downside risk left in the market.
Indexes find support
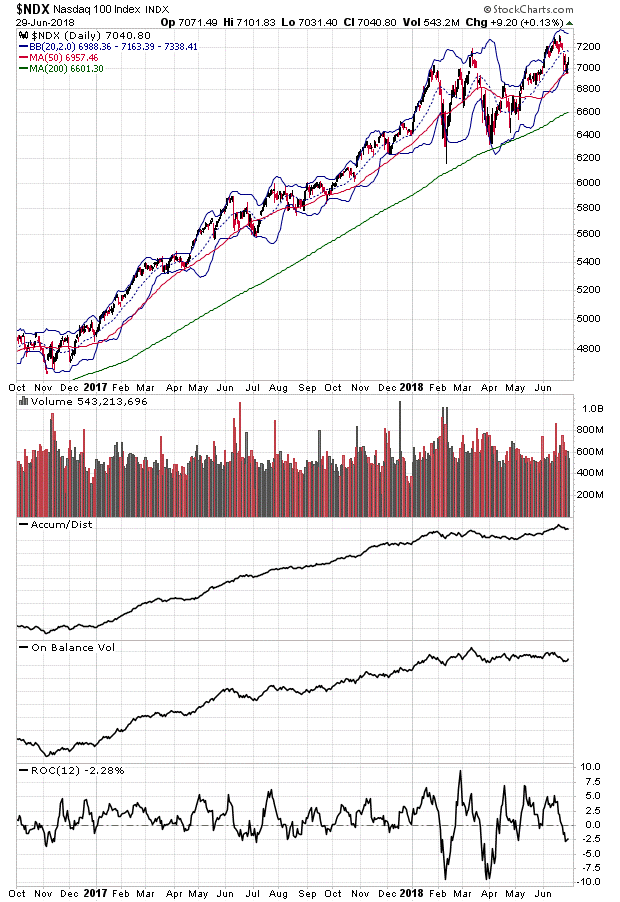
While the NYAD is a pure picture of whether more stocks are rising than falling, the S&P 500 (SPX) and the Nasdaq 100 (NDX) indexes are somewhat distorted indicators, given their weighted design, meaning that stocks with larger capitalization have a greater effect on the overall price of the index.
This is especially significant in NDX where the so called FAANG stocks Facebook (FB), Amazon (AMZN), Apple (AAPL), Netflix (NFLX) and Alphabet (GOOGL) are responsible for a significant part of the moves in the index. This is less of an issue with SPX given that it is composed of a larger number of stocks and that it has greater diversification than NDX among a larger number of sectors.
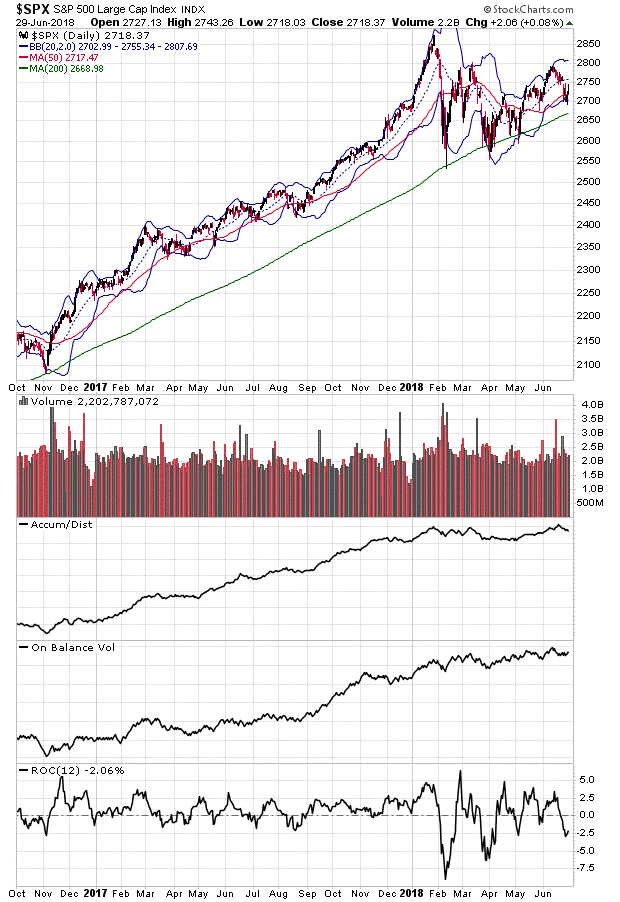
Yet, even with the built in design flaws of the indices, both NDX and SPX are also groping for support. Furthermore, despite the aggressive selling in the last two weeks, there was no overt breakdown in Accumulation Distribution (ADI) and On Balance Volume (OBV) for either of the indexes. This particular indicator configuration, in and of itself is not an all-clear sign for a 20% move to the upside in stocks. But it is also not a sign that the market has or will enter a bear market in the intermediate term.
Stock picking and risk management pays off
I’ve learned that the best way to analyze the current bull market is to keep any conclusions and possible predictions within the context of a few days, two weeks at most.
This is because program traders seem to have found a nearly foolproof way to make money by using simple technical indicators to create euphoria at the top of the trading range defined by the upper Bollinger Band, which leads to a price reversal. In turn the downside reversal triggered by the tag of the upper Bollinger Band leads to extreme fear and the market bounces when the lower Bollinger Band is tagged. The cycle repeats and the majority of investors once again transfer money to the robots as they miss the turn.
This pattern could, of course, change at any time. But it seems foolish to try to predict when that change will come.
Above all, this market is a grind. Moreover, caution and attention to detail may seem tedious. But when this approach is properly deployed it can yield big returns in short periods of time. Two instances of my recent results include a 35% gain in IRobot (NSDQ: IRBT) in 43 days and an 18.5% gain in National Beverage (NSDQ: FIZZ) in less than three weeks. The take home message is that this is a market where stock picking is the most important exercise for any investor.
Joe Duarte is an active trader and author of Trading Options for Dummies , now in its third edition and The Everything Investing in your 20s and 30s. To receive Joe’s exclusive stock, option, and ETF recommendations, including trade results, visit www.joeduarteinthemoneyoptions.com.


