

The bulls want the month to close on its high and above 2800. Furthermore, they want August to also be a bull bar closing on its high. If so, the rally will probably continue to between 3,000 – 3,200 by the end of the year, writes Al Brooks Saturday.
Monthly S&P500 Emini futures candlestick chart:
Testing buy climax high
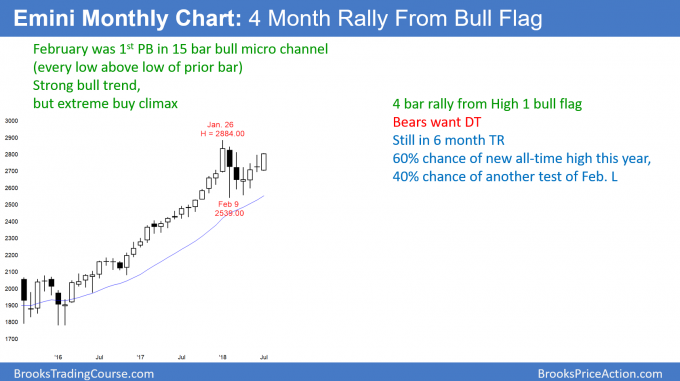
The monthly S&P 500 Emini futures candlestick chart has a big bull trend bar this month. The bulls need consecutive strong bull bars before traders will believe that the bull trend is resuming.
The monthly S&P500 Emini futures candlestick chart has had a four-month rally after a three-month reversal from a buy climax. Since the rally lacks consecutive strong bull trend bars, there is still a 50% chance that it will fail around the all-time high.
Possible double top, but it would only lead to a minor reversal
If the bulls fail to get consecutive strong bull bars, then the rally will probably fail around the January high. If it forms a double top with the January high, the pattern would only have about 10 bars. That is usually too small for a major reversal. Therefore, if the Emini sells off within the next few months, the selloff will probably be minor.
This means that it would be a second leg down after the February selloff. Sometimes a second leg down can be strong. This is because the bears see it as a break below the neck line of a double top.
However, the bear breakout would likely fail within a couple of months. The monthly chart would then either continue in its seven-month trading range, or rally from a High 2 bull flag to a new high.
Therefore, even if there is a 20% correction in the next six months, it would probably simply be a bull flag on the monthly chart. The small double top would only have a 30% chance of leading to a bear trend on the monthly chart.
It is important to note that a 20% pullback on the monthly chart would be a bear trend on the daily chart. But, that would likely be a good buying opportunity. The bull trend on the monthly chart is so strong that a move above 3,000 is likely in 6 – 12 months, even if there is a selloff to 2,300 first.
Weekly S&P 500 Emini futures candlestick chart:
Small pullback bull trend
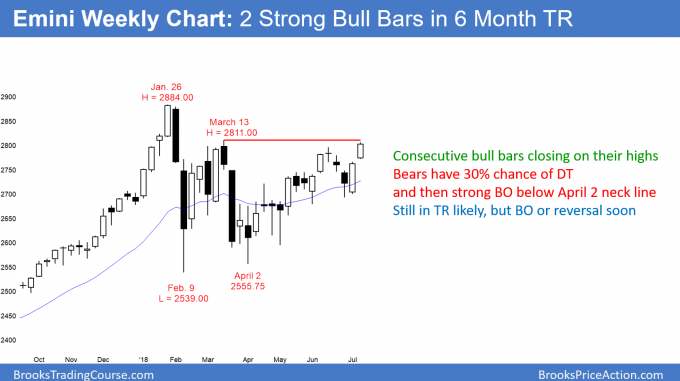
The four-month rally on the weekly S&P 500 Emini futures candlestick chart is gaining strength. However, the bulls need two closes above the March high before traders will conclude that last year’s bull trend is resuming.
The weekly S&P 500 Emini futures candlestick chart has consecutive bull bars closing near their highs. This is a sign of strong bulls. However, the bears hope that it is simply a buy vacuum test of the March lower high of 2811.00. Traders will find out over the next few weeks.
If the bears get a strong bear bar, traders will sell below its low. They would see it as a sell signal bar for a double top with the March high. The bears want a break below the April low neck line of the double top. Then, they would hope for a 250-point measured move down. However, it is more likely that the selloff would not break below the April low. Instead, it would simply be just a 1 – 2 month bear leg in the six- month trading range.
Alternatively, if the bulls get consecutive closes above that March high, traders will look for a 250-point measured move up over the next six months. The monthly chart was strongly bullish for three years. In addition, the momentum is increasing as the rally continues. Therefore, it is more likely that the bulls will reach 3,100 before the bears get 2,300.
Daily S&P 500 Emini futures candlestick chart:
Emini 2800 double top or breakout to new all-time high?
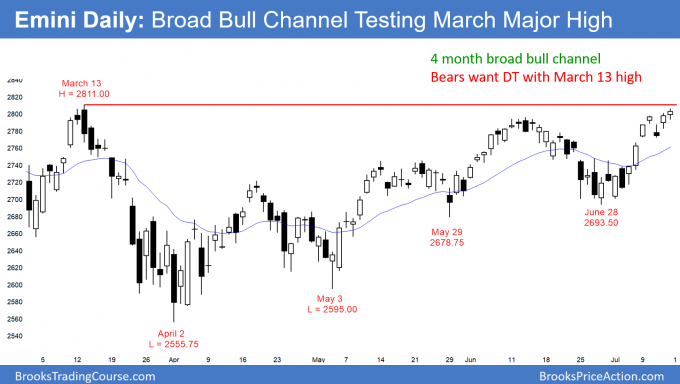
The daily S&P 500 Emini futures candlestick chart is testing the March 13 major lower high of 2811.00.
The daily S&P 500 Emini futures candlestick chart rallied strongly for two weeks. Furthermore, the swing up from the May 3 low is strong enough to be a resumption of last year’s bull trend. However, the bulls need at least a 20-point break above the March 13 high.
In addition, they need consecutive big bull bars in that breakout. Finally, they want at least two consecutive closes 10 – 20 points above that high. If the rally is a resumption of the bull trend, the bulls will accomplish most of this.
On the other hand, if they fail, then the bears will get at least a two-legged swing down over the next few months. That selloff would still probably only be a bear leg in the six-month trading range. It would likely stay above the February low. But, there is a 30% chance that it would break strongly below that February low.


