

The bears’ goal would be a break below last week’s low and at least a 50-point measured move down. They have a 40% chance as long as they can prevent a break above the July high, writes Al Brooks Saturday.
Monthly S&P500 Emini futures candlestick chart:
Strong test of all-time high
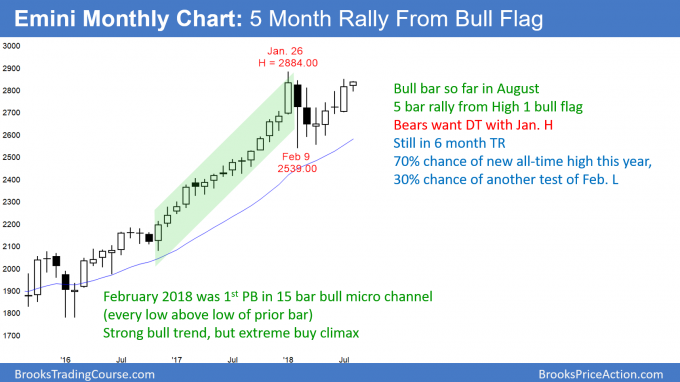
The monthly S&P 500 Emini futures candlestick chart is in a bull trend after a 3-month bull flag. A new all-time high is likely within a couple of months. The bears need a strong bear bar this month if they are going to get a successful double top. This is currently unlikely.
The monthly S&P 500 Emini futures candlestick chart has rallied for 4 months after a pullback. This followed the most extreme buy climax in the 100year history of the stock market. When the buy climax is a micro channel (15 bars without a pullback), the bull trend usually resumes within a few bars, followed by a new high. How high can it go? There is no clear target on the monthly chart. However, the measured move up based on the weekly chart is about 300 points. Therefore, a reasonable target over the next 6 months is between 3,000 and 3,200.
There is always a bear case. However, the bears need a strong bear trend bar this month. If they get it, they will then have a credible double top with the January high. But, even then, the bull trend was so strong that the reversal down will probably be minor. If they got a strong break below the neck line at the February low, the measured move target would be around 2,200. Even then, a trading range on the monthly chart would be more likely than a bear trend.
Weekly S&P500 Emini futures candlestick chart:
Last week’s sell signal failed
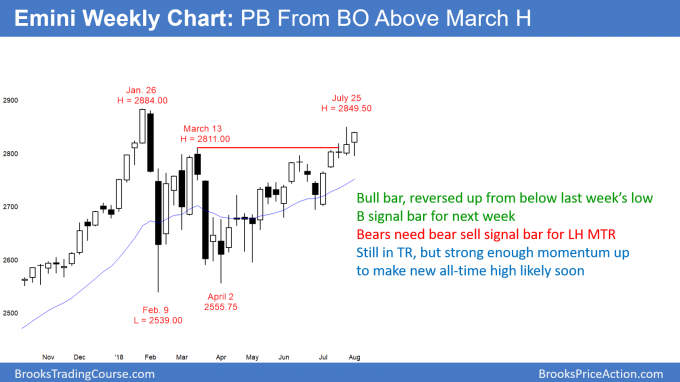
The weekly S&P 500 Emini futures candlestick chart reversed up this week from below last week’s low. It is still in a bull channel from the April low. This week is now a buy signal bar for next week.
The weekly S&P 500 Emini futures candlestick chart had a reversal down bar last week. The bears wanted a lower high major trend reversal. However, last week had a bull body. Additionally, the bull channel from the April low is tight. That made it likely that there would be more buyers than sellers below the low two weeks ago.
On Thursday, the Emini dipped below last week’s low for a few minutes, and it then reversed up strongly.
Traders see last week as a pullback from the break above the March high. It is therefore a buy signal bar for this week.
It is still possible for the bears to get a lower high major trend reversal or a double top with the January high. However, they need to form big bear bars closing on their lows. Even then, there is only a 30% chance of a strong reversal down to below the February low.
Daily S&P 500 Emini futures candlestick chart:
Emini consecutive outside bars in a bull flag
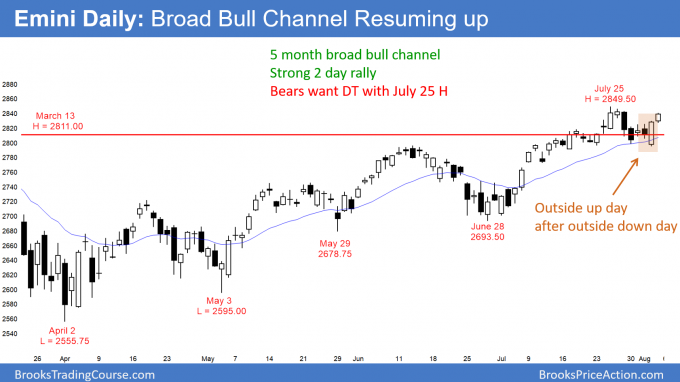
The daily S&P 500 Emini futures candlestick chart had a bear outside down day on Wednesday. This was followed by a big outside up day on Thursday. Thursday also formed a micro double bottom just above the 20-day EMA. Finally, Thursday closed above Wednesday’s high. The odds favor higher prices.
The daily S&P 500 Emini futures candlestick chart had a very unusual pattern last week. There were consecutive outside bars on Wednesday and Thursday. The bull bar followed the bear bar, trapping the bears. Additionally, the pattern is just above the 20-day EMA. It is therefore a bull flag. Furthermore, Thursday closed above Wednesday’s high.
Finally, there is a micro double bottom. These factors increase the odds of the bull trend continuing up to a new high within a couple of months. In fact, the bulls might get a new high this week, although this is unlikely.
The two big bear days on July 27 and 30 were strong enough to get a second leg down. Thursday might have been that second leg. However, sometimes the Emini will go sideways for 10 or more bars and then have a 2nd leg down. The two strong bull days probably erased the bearishness of the two bear days. But, the bulls need a break above the two bear days to eliminate the bear pattern.
If the bears can prevent a breakout above that high, they will try for a lower high or a small double top. Their goal would be a break below last week’s low and at least a 50-point measured move down. They have a 40% chance as long as they can prevent a break above the July high.


