

Second-quarter earnings growth of 24.8% was the best since 2004 (excluding the post-recession rebound in 2010). The results pushed the S&P 500 (SPX) 1.5% higher since July 12, the day before JPMorgan (JPM) kicked-off earnings season, writes Lindsey Bell Thursday.
The focus on operating results from corporate America served as a reminder of the underlying strength in the domestic fundamentals. Despite the solid earnings and economic readings, geopolitical concerns, trade tensions and, most recently, currency swings, are beginning to drive volatility higher and are weighing on markets near-term.
Historically, August and September have been the worst performing months of the year for the S&P 500. A return to a focus on fundamentals in October, with the release of third quarter earnings results, will likely usher in the return of market upside, in our view.
Second-quarter results were driven by impressive sales growth, expanded margins, lower tax rates as well as a continuation of buybacks.
Through Wednesday, 92% of the S&P 500 have reported results, with 79% of those companies beating consensus EPS estimates and 73% beating consensus revenue estimates, well ahead of the 67% and 55% historic averages, respectively. For earnings, the 79% beat was the best on record going back to 2010. Since the start of 2017, earnings have been solidly higher than the historic average.
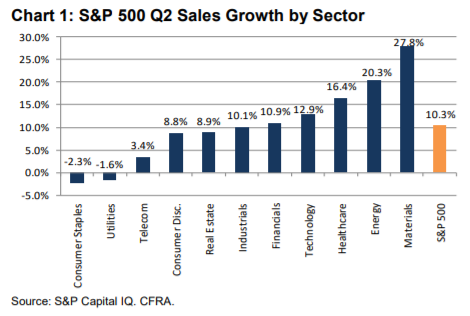
The continued rebound in sales growth has been an underappreciated detail in the last several quarterly reports. Sales strength will be key in maintaining operating margins at the highs of this expansion. In the second quarter, sales were 10.3% higher year-over-year, up from about 9% in the prior two quarters and significantly higher than the average growth rate of 4.0% since the emergence from the Great Recession.
The consensus estimate for sales growth at the start of the reporting period was 8.8%. The upside surprise was widespread, with only materials and telecommunication services reporting sales below the initial estimate.
Financials, real estate and industrials had the largest upside surprises versus the consensus estimates at the start of the reporting period. Six sectors reported double-digit growth, with total sales growth led by materials, energy, health care and technology.
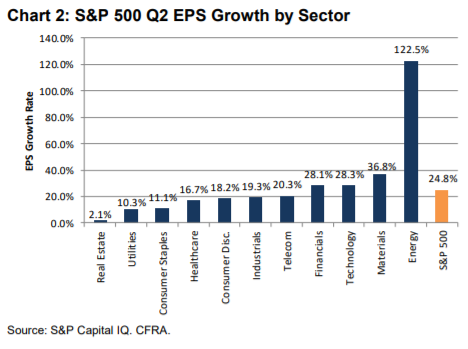
On the bottom-line, ten of the 11 S&P 500 sectors are reporting double-digit growth. Real estate is the one outlier with EPS growth of 2.1%, but that is better than the -3.7% initial estimate.
Total EPS growth of 24.8% is 527 basis points (bps) better than the 19.6% estimate at the start of the reporting season. That is much better than the historical average beat of 350 bps.
Driving the upside was utilities (with growth 1,156 bps better than the consensus expectation on July 12), technology (683 bps better), materials (679 bps better) and health care (678 bps better).
Energy was the only sector where growth was lower than the initial estimate, at 122.5% vs. the 143.3% estimate. Absolute growth by sector is shown in the chart below.
Stocks reacted much more significantly to reported results this quarter than in the first quarter. On average, companies that beat on sales and earnings were rewarded with a 1.2% pop on the day of the report.
In the past four quarters, stocks advanced only 0.4% points on average under the same scenario. The second quarter reaction comes despite a 2.8% advance in the S&P 500 index a month and a half ahead of earnings season.
Industrial and consumer discretionary sector stocks were rewarded the most for top-line and bottom-line beats, with stocks in those sectors advancing 2.5% and 2.3% on average, respectively.
otably, those companies that missed sales and earnings expectations were greatly punished, declining 2.1% on average. Technology stocks experienced the largest declines in reaction to sales and earnings misses, with stocks declining 12.3% on average the day of the announcement.
Looking out to the second half of 2018, growth expectations for the remainder of the year remain solid for the S&P 500. Quarterly growth is projected to average 20.5% in the next two quarters, slightly higher than estimates in July.
Typically, consensus growth estimates decline as the second and third quarter unfolds, but that has not been the trend this year. Full year 2018 growth is now pegged at 22.2%, well ahead of the 18.5% expected in April. Full year 2019 estimates have also remained stable at 10.0%. In April the 2019 projection was for growth of 10.4%.
Underlying strength in corporate profitability and economic data should bode well for the market long-term. Near-term, we see risks in the potential for a trade war with China (among others); geopolitical concerns; and skittishness regarding inflation and higher interest rates.
As the risks become more of a focus in the next month or two, with fundamental news taking a backseat, the market may struggle in a period that has been historically weak seasonally. The election cycle will also add an additional level of volatility to the market as we approach mid-term elections. However, we remain optimistic about performance in the latter part of the year as the market returns its focus on fundamentals and usually sees a 16% rally on average in the 12 months following mid-term elections.
Best,
Lindsey
Lindsey Bell on why Q2, Q3 sometimes the worst, Q4 has good news, in a short video here.
Recorded at MoneyShow Las Vegas, June 22, 2018.
Duration: 3:53.
Please consider joining me and an impressive list of investors and market observers at The MoneyShow in San Francisco on August 23-25. LindseyBell.SanFranciscoMoneyShow.com
A full schedule of events can be found here:


