

Looking at the third column to the right (chart below) we see a comparison of higher risk asset classes and defensive asset classes back to the S&P 500 (SPY) on an annual basis. Comparison to the S&P 500 creates a “risk-ladder” where market risk is considered neutral.

View my Market Strategy Session video here:
Recorded: August 17, 2018.
Duration: 1:29:31
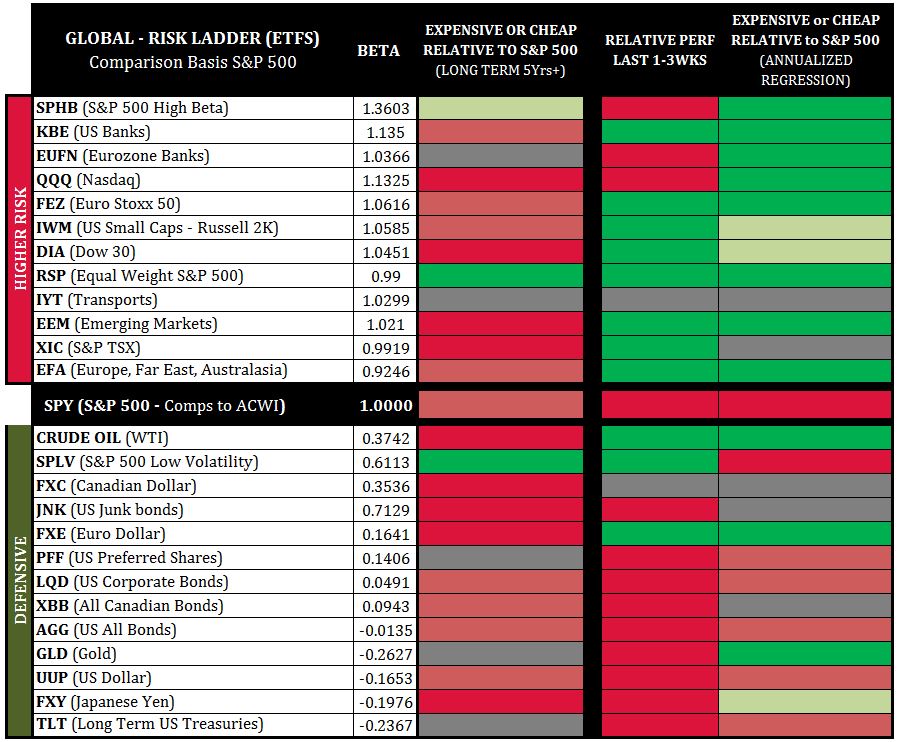
When we see more green above the SPY-line (middle-line) and more red below we have a general “risk-on” signal; and vice-versa - red above, green below would be “risk-off.”
Currently, higher-risk asset classes are generally on the cheaper side of annual routines.
Defensive-Asset-Classes have enjoyed a temporary flattening of yields, and currently present as neutral to expensive. This allows for the risk-on event sparked on August 17 (US-China trade talks) coupled with a steepening yield curve to carry forward to this week.
We started capitalizing on the risk-on move of August 17 in the following spaces: SPHB, KBE, EUFN, QQQ, FEZ, DIA, RSP, IYT, EEM, XIC-T, EFA, Oil (USO), FXE, GLD.
But we recognize how headline-driven this market is, and that we are in a highly illiquid period, and hence remain very tight with stop-loss-management.
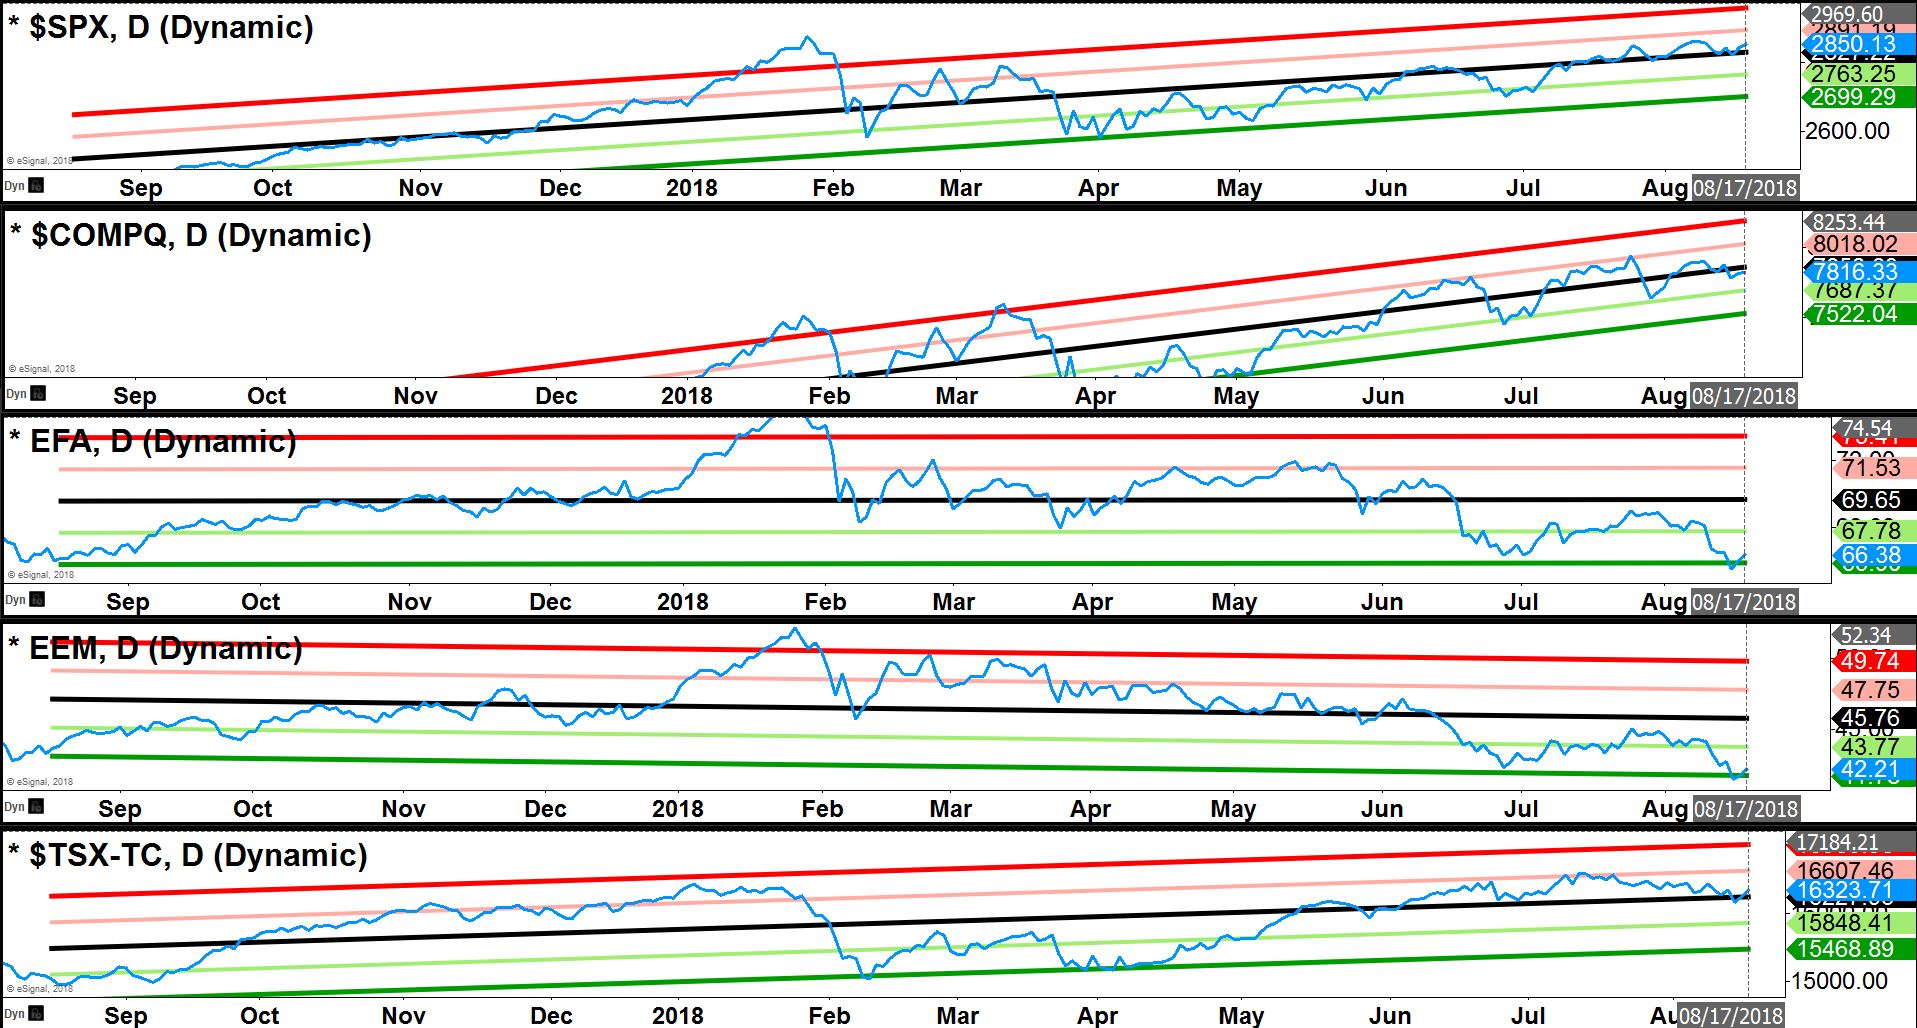
Major Index Direct Price Regression
When humans move very far away from normal routines they tend to come back home.
In Markets, we call this mean-reversion.
The channels to the right are direct closing prices day over day, enveloped in 2-standard deviation channels (“home” is the middle of the channel).
Currently, the Eurozone Far-East & Australasia (EFA) & Emerging Markets (EEM) present ~2 standard deviations cheap, the S&P 500 (SPX), Nasdaq and TSX have neutralized.
This presentation suggests that equities have a better chance of rising to start this week with EEM & EFA having a better chance to outperform S&P 500, Nasdaq, Dow & TSX.
Join Ziad at MoneyShow Toronto Sept. 15 when he discusses Portfolio Management Strategies for Active Investors. Information: ZiadJasani.TorontoMoneyShow.com


