

The midterm elections have sometimes been included in lists which review risks the market faces. I’m not a huge bull, but I am still objective. The midterms won’t cause a correction, writes Don Kaufman over the weekend. Growth is about to slow.
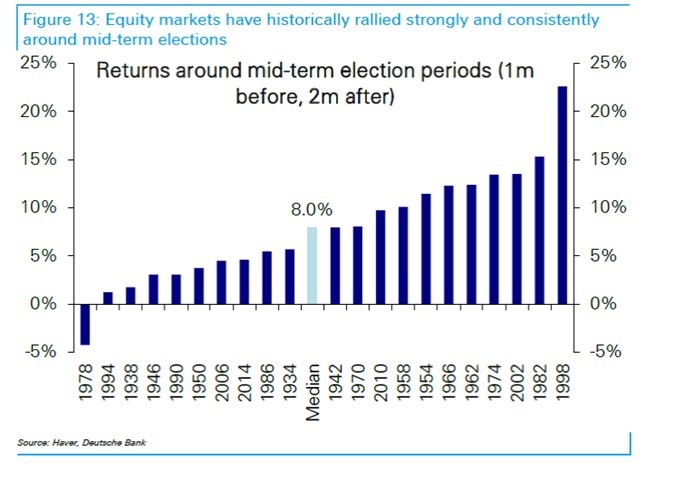
The chart below shows the returns around the past mid-term elections.
On average, in one-month periods before the mid-term election and the two months after it stocks are up 8%. They increased every time except in 1978. It’s also worth noting that election cycles correlate with the economy.
Usually there is a recession before presidents come into office and they usually enact a stimulus which boosts the economy. This past presidential election there wasn’t a recession, but there was a slowdown in 2016.
The latest polls show there are 199 likely Democratic House seats and 193 likely GOP House seats. With 43 tossups, it’s anyone’s guess which party will win.
I expect the GOP to lose seats because the party of the president tends to lose seats. The Senate map is terrible for the Democrats because they are defending more seats than the GOP.
Therefore, the expectation is for no net pickups which means the GOP will hold the Senate by one seat. The GOP is likely to win 48 seats and the Dems are likely to win 45 seats as there are 7 tossups. Four races are within 1.6 points, so anything can happen.
Growth about to slow
I’ve reviewed a few data points which are negative this week. The Citi surprise index is at -19.2 as the reports are missing estimates. I have been negatively biased for few months because of the cyclical slowdown seen in the ECRI index.
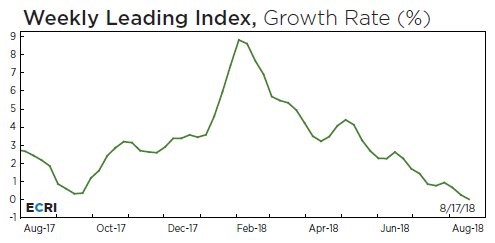
As you can see from the chart below, the leading index is now flat on a year over year basis. The comparisons are getting easier, but the index keeps falling, so the year over year growth is declining.
This indicator hit zero in February 2016, April 2015 and August 2012. Those are all times the economy was weak. Now it looks like the economy is strong because of the strong Q2 growth rate. The U.S. long leading index, the U.S. short leading index, and the U.S. coincident index are all weak, supporting ECRI’s call for a cyclical downturn.
Powell’s Jackson Hole speech: continue gradual hikes
The August Jackson Hole speech by the Federal Reserve chair is the most important monetary policy speech of the year because it gives an explanation of the chair’s long-term outlook. The chair is free to discuss whatever he wants which means the topic can tell us where he thinks policy is going.
In Yellen’s last speech she discussed the importance of regulations because President Trump has argued for banks to be deregulated. The main takeaway from Powell’s speech on Friday is that the Fed will keep going with gradual hikes this year and next year.
Powell said, “I see the current path of gradually raising interest rates as the [Federal Open Market Committee’s] approach to taking seriously both of these risks. As the most recent FOMC statement indicates, if the strong growth in income and jobs continues, further gradual increases in the target range for the federal funds rate will likely be appropriate.”
I think the rate hikes will end by 2019. That doesn’t go against his statement because there’s no need to caution about the end of rate hikes in 16 months even if this speech is on the long-term outlook of the Fed.
Fed expected to hike 3 more times
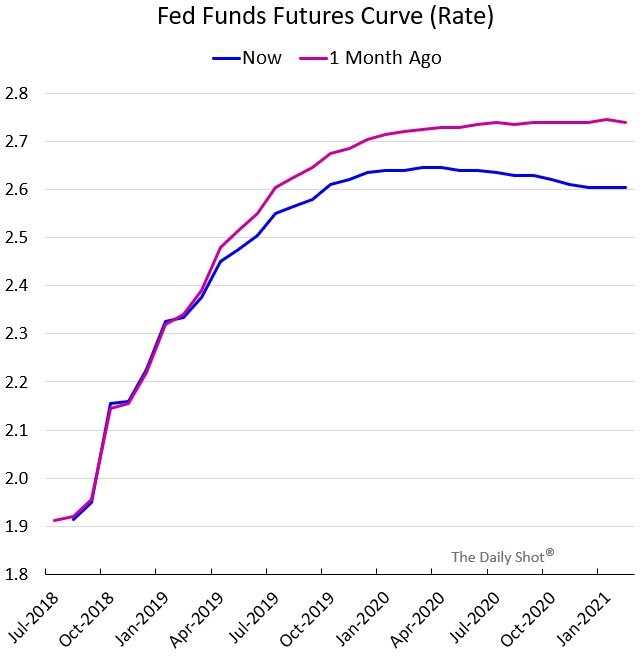
The chart below shows the expectations of the Fed funds futures market for the rest of the cycle. It’s interesting to see the change in expectations in the last month.
The recent weak data isn’t lost on the Fed funds futures market as it now expects rates to be lower and plateau in early 2020. The Fed funds futures are skeptical of the Fed’s ability to hike rates 2-3 times in 2019 as they only see 3 more hikes in the rest of the cycle.
The Fed is now floating the idea of the end of the balance sheet unwind. I am interested to see when it changes its tune from normalization, to ending rate hikes. Either the futures curve will change, or the Fed’s tone will change in one year. If the Fed keeps hiking rates, it will cause the economy to slow. The first step towards finishing up the hikes is the Fed eliminating the word accommodative in its statement which will happen in either September or December in my opinion.
Inverted OIS
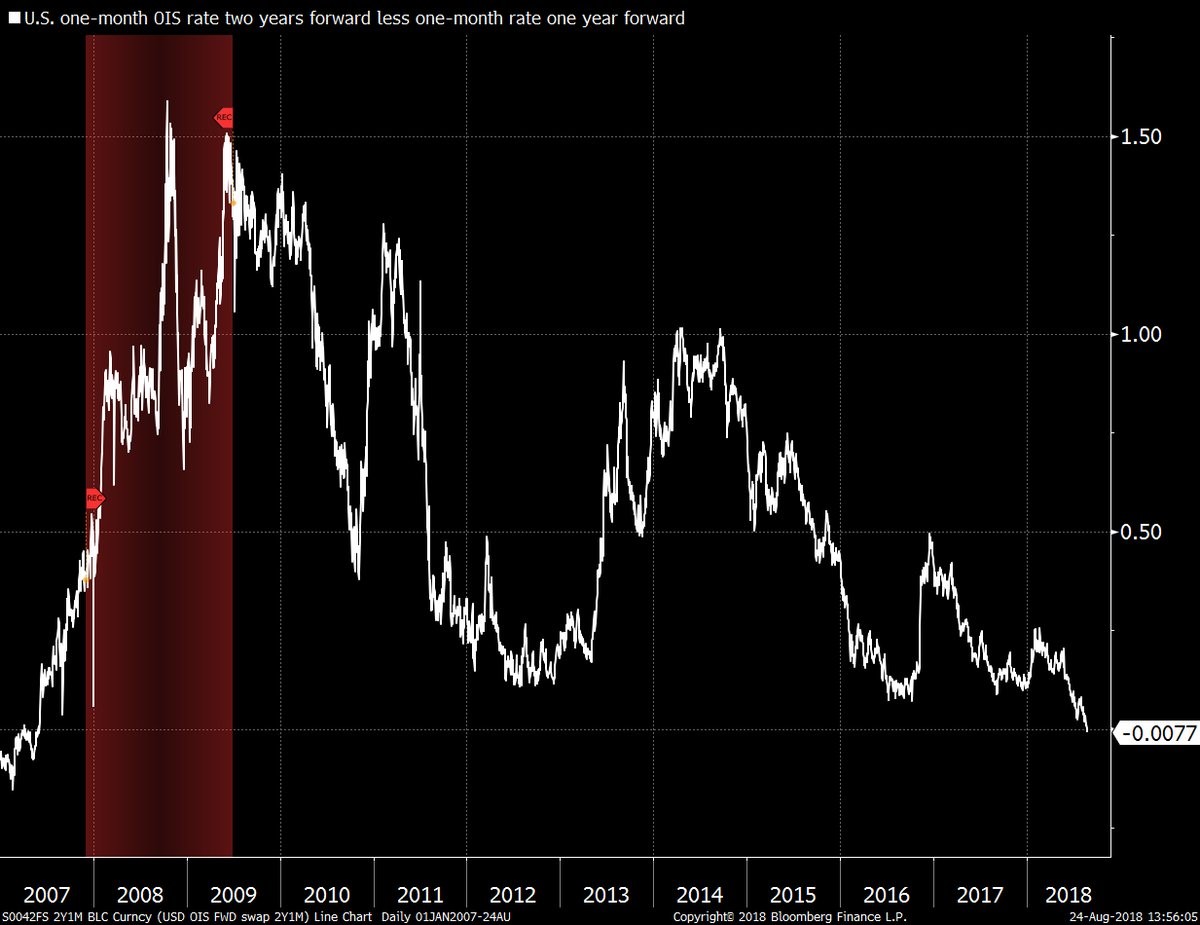
A sign that the yield curve will invert is when the options adjusted curve inverts. As you can see from the chart below, the one year forward options adjusted rate is higher than the two-year options adjusted rate. This is the first inversion since 2007 which is an eerie sign that the cycle is near its end.
The most difficult part of judging this cycle is that it seems like the timing is aligned with a recession occurring in 2020, but there aren’t excesses in the economy outside of high sentiment readings.
Optimism by consumers and businesses doesn’t cause bubbles. There needs to be excessive debt. The economy doesn’t have this problem. The stock market is similar in that there was record optimism in January, but stocks didn’t have high forward multiples.
This all leads me to believe there will be a shallow recession only slighter sharper than the 2015-2016 slowdown.
Conclusion
Powell is in favor of continuing gradual rate hikes. Two more hikes are coming by the end of the year. This policy might end soon as the market only expects one hike in 2019.
The chance of a rate hike in December actually fell slightly on Friday because of his speech. There was a 68.6% chance of at least two more rate hikes by the end of the year before the speech and now there is a 63.7% chance.
Subscribe to TheoTrade here...
View a brief video interview with Don Kaufman on volatility for traders and investors here
Recorded at TradersExpo New York Feb. 25, 2018
Duration: 2:34.


