

The daily S&P 500 Emini futures candlestick chart has made three pushes up since July 23. The rally is therefore a wedge top. The five-month bull trend is strong enough to make a new all-time high likely this week beginning August 27, writes Dr. Al Brooks Saturday.
Monthly S&P500 Emini futures candlestick chart:
Testing the January all-time high
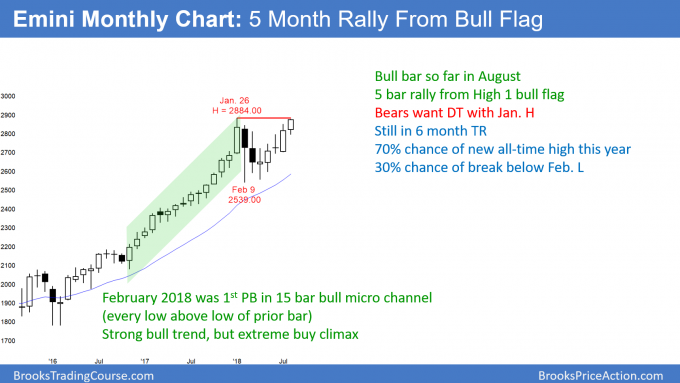
The August candlestick on the monthly S&P 500 Emini futures chart so far is a bull bar. The bears want a double top with the January high, but the odds favor a new all-time high soon.
The monthly S&P 500 Emini futures candlestick chart is resuming its bull trend from 2017. Although the cash index made a new high last week, it was only by $3. However, the momentum up in the Emini is strong. Therefore, the odds favor a new all-time high the week of August 27.
The 2017 bull trend is strong enough to make a bear trend reversal unlikely. Even if the Emini reverses down from a double top, the bulls will likely buy the selloff. It therefore would probably last only a month or so before the rally resumes.
Weekly S&P 500 Emini futures candlestick chart:
Emini possible gap up above January all-time high
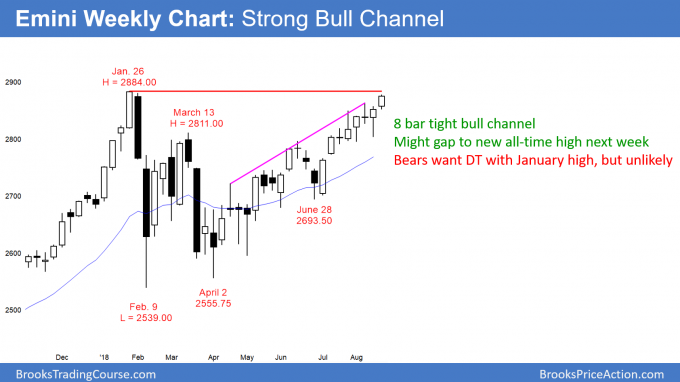
The weekly S&P 500 Emini futures candlestick chart last week got to within 6 points of the January all-time high. In addition, the week closed on its high and the eight-week bull channel lacks strong bear bars. The odds favor a new all-time high this week starting August 27. The rally is strong enough so that the Emini might even gap above the January high.
The weekly S&P 500 Emini futures candlestick chart rallied strongly for eight weeks. There were no big bear bars in the rally. That lack of selling pressure makes a trend reversal unlikely. The best the bears will probably get is a few weeks of sideways to down trading.
The five-month bull trend resumption is strong enough to make a new all-time high likely this week. Last week closed on its high just below the resistance of the January high. Therefore, Monday might gap up to a new all-time high next week. Whether or not it does, if this week is a big bull trend bar, the odds are that the rally will continue up over the next several months to the measured move targets around 3100 and 3250.
The bears need a big bear bar before traders will believe that the rally is failing. Furthermore, they need several consecutive bear bars before traders believe that the bears have begun a swing down. That would take several weeks. Consequently, the downside risk over the next few weeks is small.
Daily S&P 500 Emini futures candlestick chart:
Strong rally to just below January all-time high
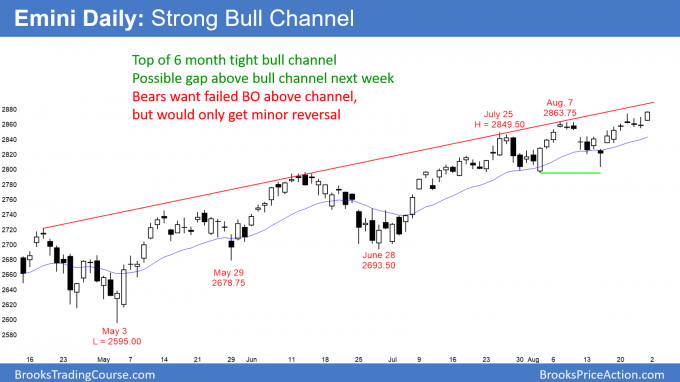
The daily S&P 500 Emini futures candlestick chart has made three pushes up since July 23. The rally is therefore a wedge top. However, the five-month bull trend is strong enough to make a new all-time high likely this week beginning August 27.
The rally on the Emini daily chart since the June 28 low is very strong. Friday closed on its high, and Monday might gap up. A big gap would create a gap above the January all-time high. If Monday is a big bull trend day, the Emini could quickly reach the measured move targets around 3100 and 3250.
Because the daily chart is still in a seven-month trading range, there is a 50% chance of a test down to the middle of the range at around 2700 before reaching the 3100 first target. Furthermore, there is a 40% chance of a test of the bottom of the range at around 2550. Finally, as unlikely as it might seem, the bears have a 30% chance of a break below the range and a measured move down.
That would be a 20% selloff down to around 2200. However, the bears need to create a series of big bear bars closing near their lows, which is unlikely. Unless they do, the odds continue to favor higher prices.
Measured move targets for the bulls
There are different ways to create measured move targets for the bulls. Using the February low and the January high, a measured move up would be around 3250. There was a double bottom with the February and April lows. The March high is the neck line. The measured move projection is just below 3100. Finally, the 3000 Big Round Number is a less important psychological target.
Does the Emini need to hit any of these targets before falling 10 – 20%? Of course not. But, the momentum up is strong enough to make higher prices likely. These are targets that traders think are reasonable.
Bears hope for small wedge top reversal at January high
The bears see a month-long wedge top at the January high. A reversal down from here would therefore be a big double top in addition to the small wedge top.
But, the bull channel from the June 28 low is tight. Furthermore, there have not been many big bear bars and therefore there has not been significant selling pressure. As a result, a reversal down might have a couple legs and last a couple of weeks, but a major reversal is unlikely. There is support at 2800, which is the June high and the July low.


