

At the Independent Investor Institute, our investing community prepares for a precarious Equity Market to end the Q3 2018; we see more downside risk for the next two weeks. A small bounce may precede, writes Ziad Jasani. He’s presenting at MoneyShow Toronto.
View my Market Strategy Session here.
Recorded: Sept. 7, 2018.
Duration: 1:58:56.
Why are we negative into the back-end of September?
• Trade wars = Global growth outlook and Business Investment stressed (The next round of Trump tariffs are less likely to be “neutralized” by active Chinese yuan devaluation, in order to avoid a August 2015 moment)
• USD strength = Emerging Markets, Materials & Metals stressed.
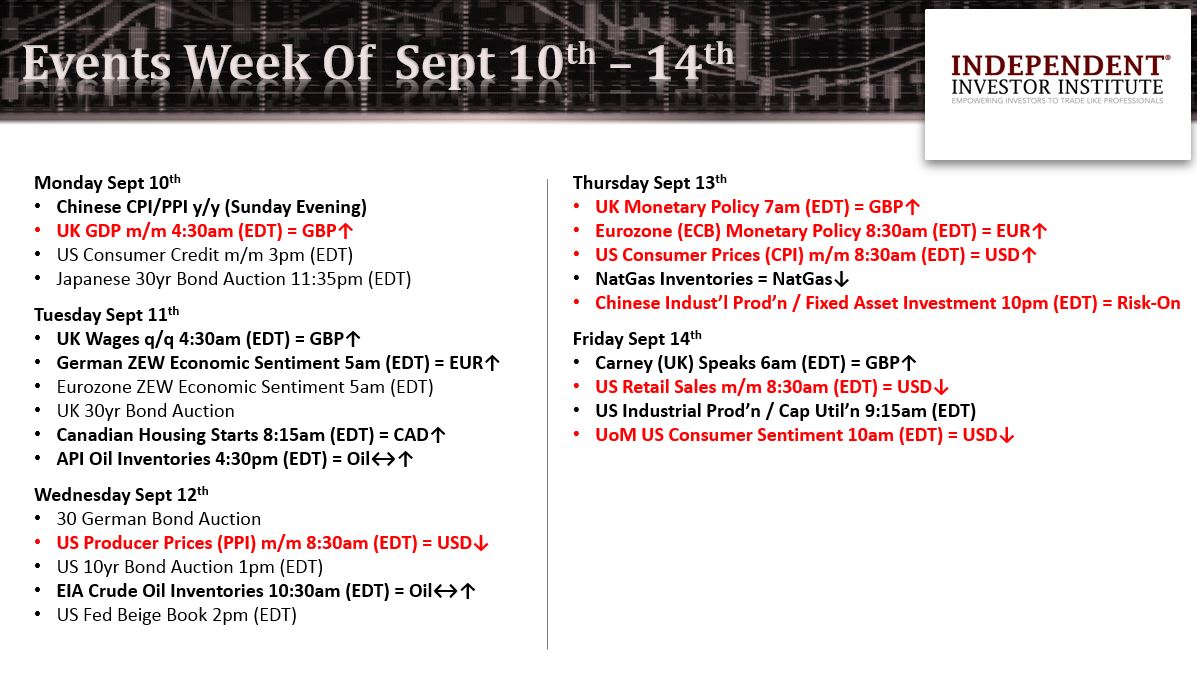
• Fed still ramping up to monthly balance sheet normalization target of $50B = USD monthly-liquidity-drain to peak Oct. 2018.
• US Fed hikes Sept. 26 but yield curve likely flattens (long-term rates don’t rise) as softer growth-outlook keeps flows tilted to Bonds = U.S. banks face margin erosion.
• US inflationary pressures “under control” while U.S. growth remains strong = Fed keeps existing flight-path for rate hikes = Families pay more to borrow = Consumption stressed (consumer-confidence-metrics already plateauing).
• Corporate share buybacks exacerbate overvaluation picture in Developed Market Equities = equity flows toward stronger economies (U.S.) peak. Could a short-term bounce (days-to-a-week) present first?
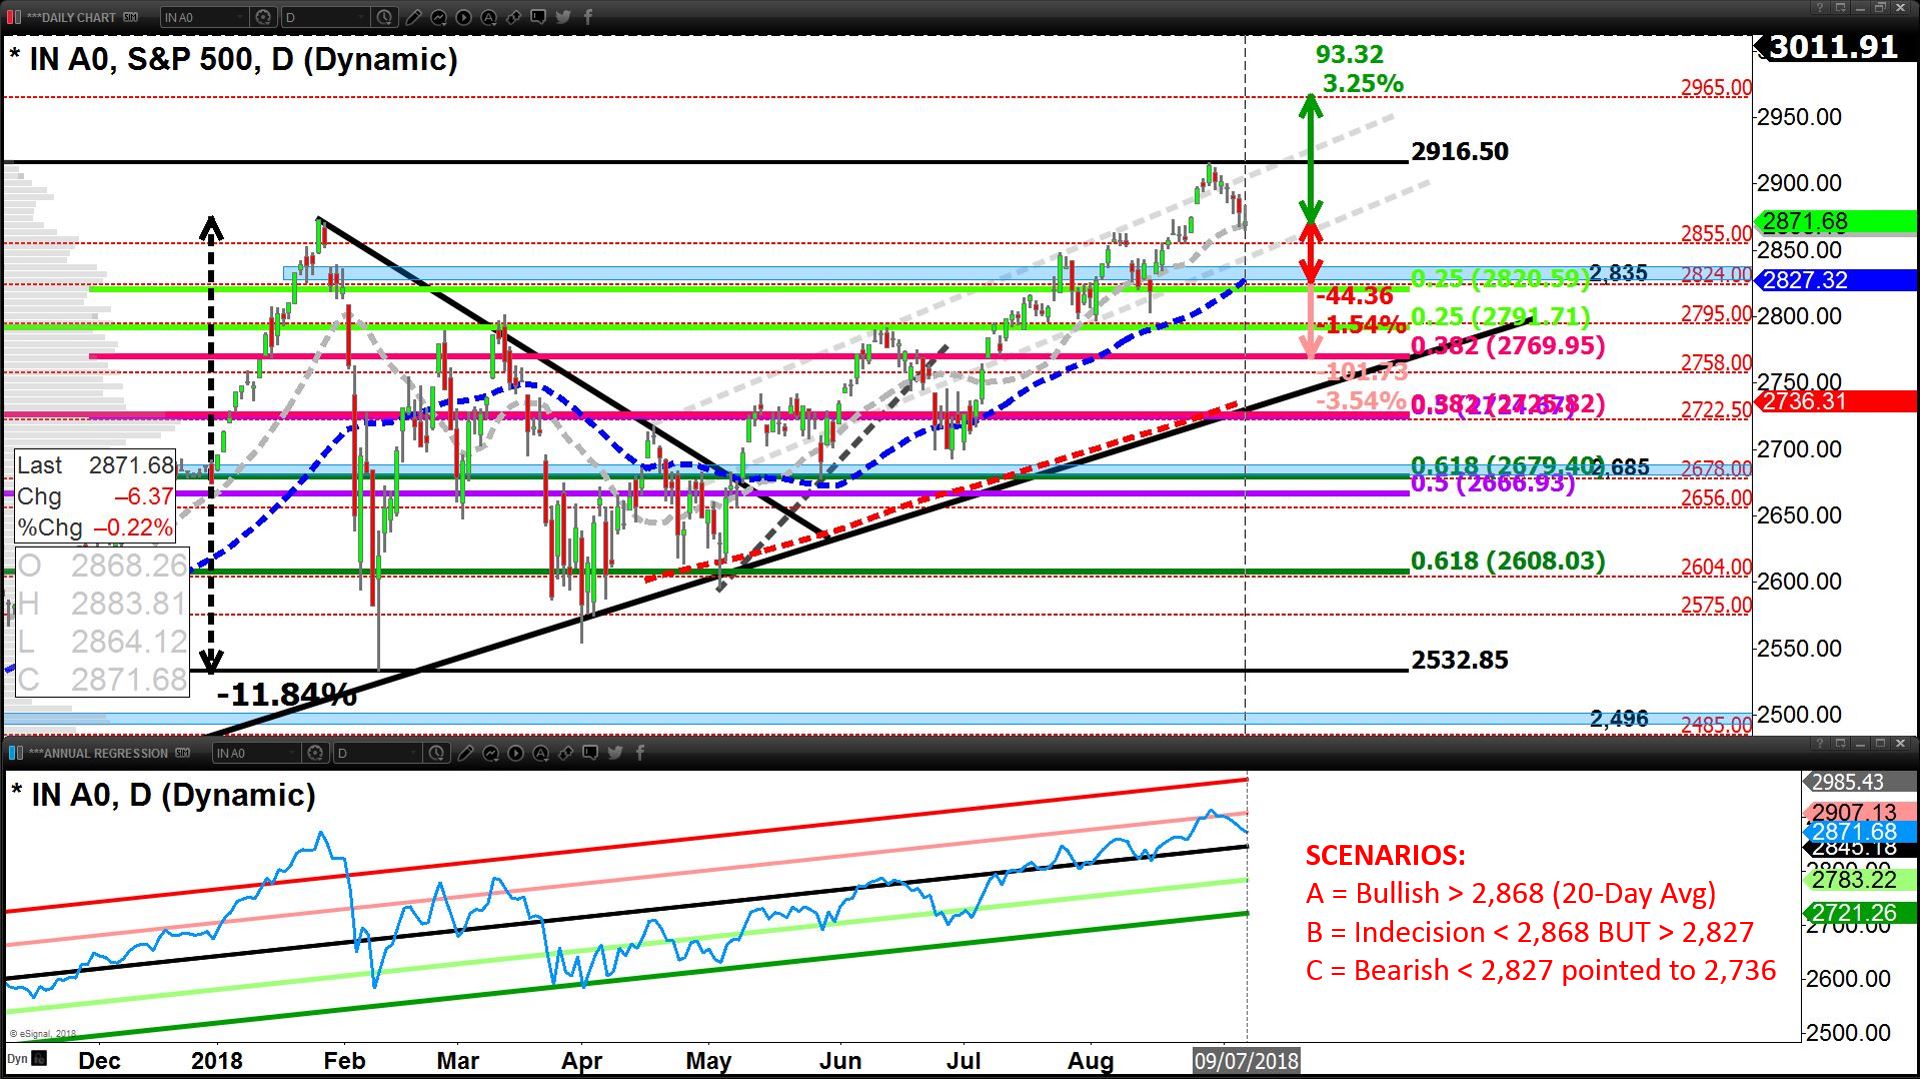
Does Mr. Market (S&P 500) give us one more bounce before Powell takes rates up?
Or do we turn down to re-test the 50-day average (2,827 -1.5% away) or lower, the 200-day average (2,736 -4.7% away)?
Since the S&P 500 made all-time-highs on Aug 29, 2018 (2,916.5), short-term bullish sentiment has slightly weakened of the last 6 days (-45pts or -1.5% down from all-time-highs S&P 500).
Yet, Mr. Market holds onto a bullish up-trend from May 3, with price still above the 20-day average, which is above the 50-day average and in turn above the 200-day average.
The recent draw-downs of July 25 – 30 and Aug 7 – 15 resulted in -50 points and -61 points respectively and lasted 3 and 6 days.
• Regulatory risks bruising Technology: It will be a very long time before the Tech Lobby loses to Uncle-Sam; Dorsey’s & Sandberg’s testimony last week was irrelevant – focus on whether demand and profit is still growing (they are).
Signs of Tech coming back to life on Sept. 7 = encouraging for a short-term bounce.
• Are inflationary pressures building? Similar to the Feb. 2 U.S. payrolls data which caught markets by surprise and catalyzed a correction, the Sept. 7 wage inflation print does prove concerning – yet markets did not sell-off, nor did Gold/Silver, nor was the USD bid-up strong enough to suggest real concern, nor are bonds in as “dangerous” a place as in Feb. 2018.
The Sept. 7 payrolls data printed a hot wage inflation number, however, the print was predicated on aggregate payrolls declining at a slower pace than aggregate hours; an artificial wage inflation print was the result. As such we believe a rise in the USD is likely contained and furthermore 30-day correlations suggest U.S. Treasury yields move in the opposite direction of the USD (short-term).
• U.S.-China tariff war heating-up: Remains the biggest issue for a bounce to transact in the week ahead; so far the $200 billion of new Trump tariffs and threat for another $267 billion have not gone live, but if the Dow chart is a barometer, it does depict down-side risk.
Enjoy a complimentary-no-strings-attached 30-day subscription to Ziad Jasani’s Daily Insights. Simply send Ziad an email with “FREE TRIAL” in the subject: ziad.jasani@educatedtrader.com


