

I’ll discuss the latest disappointing inflation reading today. The CPI miss followed the PPI miss. The 2.9% nominal wage growth seen in the August BLS report isn’t matching with headline and core inflation. This means real wages are set in improve, writes Don Kaufman.
Interestingly, the Fed funds futures and breakeven inflation are roaring on the news of wage growth even though headline inflation hasn’t been strong. This shows the Fed and the market are anticipating inflation accelerating in 2019 as wage growth should continue to increase as the slack in the labor market is eaten up.
The breakeven inflation rate hasn’t been falling since the weak PPI report on Wednesday. The 5-year breakeven inflation rate was up one basis point to 2.02% on Wednesday and the 10-year breakeven rate was flat at 2.12%.
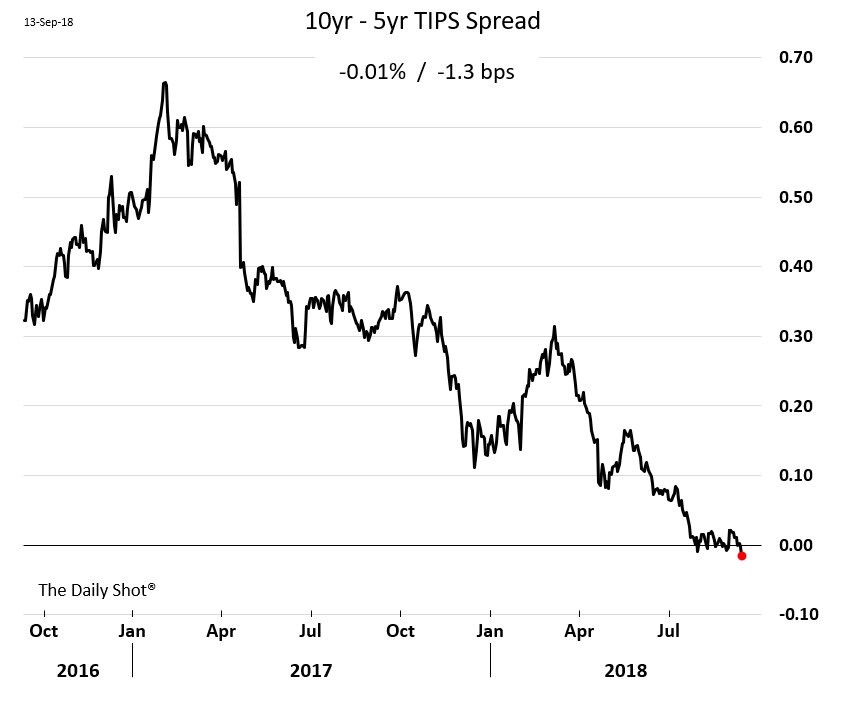
As you can see from the chart below, the 10-year minus the 5-year TIPS spread has inverted. The short answer to the question of whether this matters much is it doesn’t. It’s a prequel of what’s to come in the Treasury market. However, recently long bond yields have been rallying which has delayed the inevitable by at least a few months.
Core CPI & Headline CPI growth fall
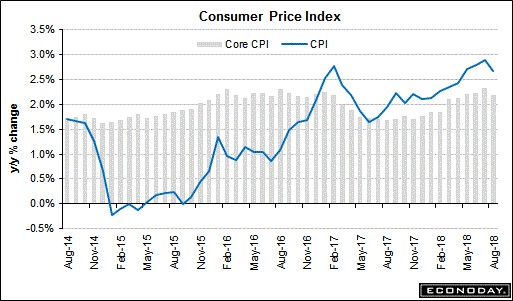
Month over month August headline CPI was up 0.2% which missed estimates for 0.3% growth and was below July’s growth of 0.2%. As you can see from the chart below, year over year headline CPI was up 2.7% which fell from 2.9% in July and missed estimates for 2.8%.
Core CPI was up 0.1% month over month which missed both the consensus and July’s reading of 0.2%. As you can see in the chart below, core CPI was up 2.2% year over year which missed estimates for 2.3% and last month’s report of 2.4%.
Both readings look like they are peaking near the same percentage as late 2016 and early 2017. Year over year comparisons drive changes in these indexes. Oil also drives change in the headline reading.
Housing & Transportation drive headline CPI
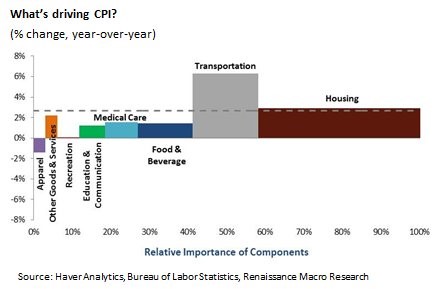
Since we are supposed to be late in the cycle, you would think we’d be looking for the components which have driven up CPI, but we’re actually looking at which components drove it down. The chart below measures the size of the category’s effect on CPI by the width of the bar.
The height tells you the inflation or deflation rate and the dotted line shows the current year over year CPI. As you can see, apparel, other goods and services, recreation, education and communication, medical care, and food and beverage inflation are all pulling down the overall number.
Only transportation inflation, which is driven by energy prices, and housing inflation are pushing the overall rate up.
It’s debatable if Fed policy can bring down inflation because zoning restrictions are pushing up housing costs and global energy supply and demand affect transportation inflation.
Luckily, the Fed doesn’t need to worry about inflation because it is receding. Based on the PPI report, core PCE and headline PCE inflation should decelerate in the August report.
Let’s go over the specifics of the report. Medical costs and food prices held down inflation. Medical care is 10% of CPI. It was up 1.5% year over year and down month over month for the second straight month.
Apparel prices were down 1.6% month over month which was the third straight monthly decline. Apparel prices were down 1.4% year over year. Recreation prices were down 0.1%. Food prices were up 0.1% month over month and up 1.4% year over year.
Housing is 40% of the index as you can see from the wide bar in the chart above. This is why housing drives inflation even though it is only slightly above the overall result. Housing prices were up 0.3% month over month and 2.9% year over year.
Energy is less than 10% of the index. It is a portion of the transportation bar above and is driving it higher. Energy prices were up 1.9% month over month and 10.2% year over year.
Retail sales miss estimates
I was expecting a blowout report from retail sales because wage growth accelerated and the Redbook same store sales report hit a 13 year high recently. However, it missed estimates across the board.
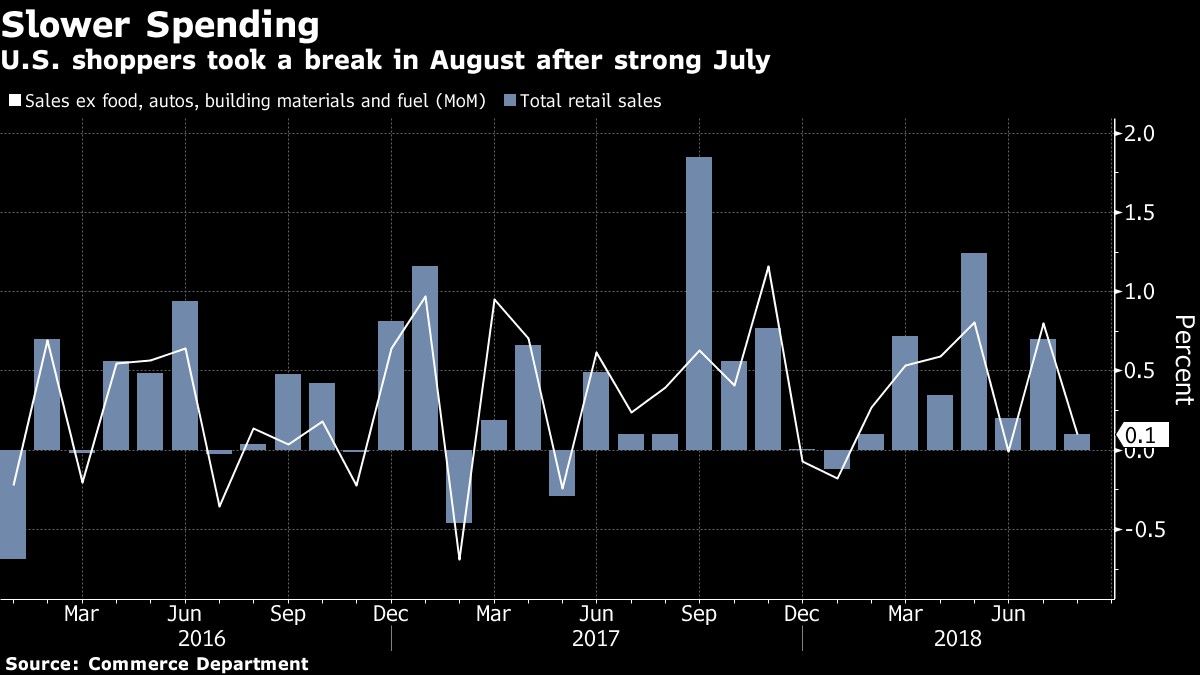
As you can see from the chart below, retail sales were up 0.1% month over month after a strong July. July’s month over month retail sales growth was revised to 0.7% from 0.5%. This tough comparison partially explains the disappointing result in August.
Retail sales excluding auto were up 0.3% month over month which missed estimates for 0.5% growth. July’s report was revised high from 0.6% growth to 0.9% growth.
Excluding autos and gas, month over month sales were up 0.2% which missed estimates for 0.4% growth. July’s report had growth moved from 0.6% to 0.9%. The control group had only 0.1% growth as you can see from the chart below. This missed estimates for 0.4% growth. July’s results were revised from 0.5% growth to 0.8% growth.
Motor vehicles drove weakness as their sales were down 0.8% after falling 0.1% in June and July. Auto sales will get a boost in October because hurricane Florence destroyed so many cars. Apparel sales fell 1.7% month over month.
Department store sales fell 1% and furniture store sales were down 0.3%. Building material sales also fell 0.3%. E-commerce sales outperformed once again as growth was 0.7%. Sales at gas stations rose 1.7% because of higher gas prices. Restaurant sales were up 0.2% which is a decent accomplishment because of the tough comparison.
On a year over year basis, total retail sales were up 6.6% which was down from 6.7% in July. Online stores had the highest sales growth as year over year sales were up 10.4%.
It’s clear this was a decent report because year over year growth was solid and month over month growth was only weak because July had a sharp revision upwards.
Subscribe to TheoTrade here...
View a brief video interview with Don Kaufman on volatility for traders and investors here
Recorded at TradersExpo New York Feb. 25, 2018
Duration: 2:34.


