

Traders always should think about low probability events because they are usually more likely than what seems reasonable. Currently, there is a 50% chance that the September top will be the start of a move down to the 20-week EMA, writes Dr. Al Brooks Saturday.
Monthly S&P 500 Emini futures candlestick chart:
6-month rally to new all-time high
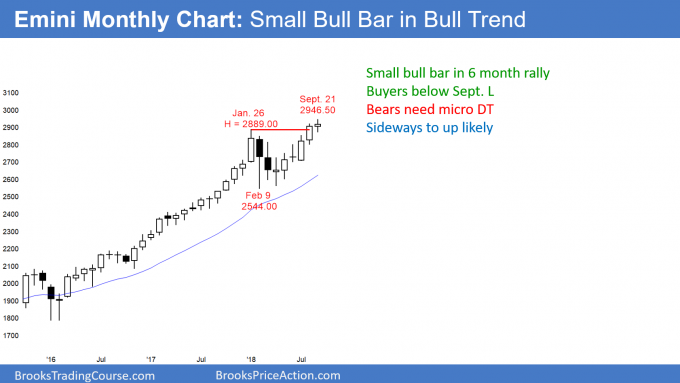
The September candlestick on the monthly S&P 500 Emini futures candlestick chart is a bull doji. It is the 6th bar in a bull micro channel. But, because it is smaller, it is a sign that the bulls are losing momentum.
The monthly S&P 500 Emini futures candlestick chart has continued its rally from the April micro double bottom. There is no sign of a top. Furthermore, after a 6-bar bull micro channel in a strong bull trend, the bulls will buy the 1st reversal down. Therefore, there will be buyers below the September low.
The bears will need a micro double top to get a trend reversal. Consequently, the downside risk is small over the next couple of months. October sometimes has sharp selloffs. But, since the monthly chart is so strongly bullish, even if the bears get a 5% – 10% selloff, it will be a pullback in the bull trend and not the start of a bear trend.
The bears will need at least 2 or 3 consecutive bear bars before traders believe that the bears have taken control. As a result, the odds continue to favor higher prices.
Weekly S&P 500 Emini futures candlestick chart:
2-month tight bull channel in 6-month bull trend
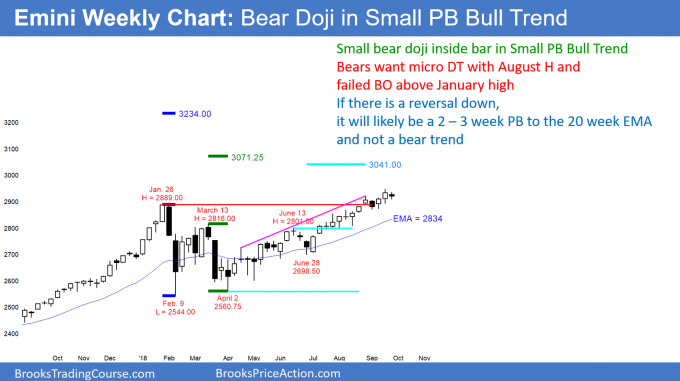
The weekly S&P 500 Emini futures candlestick chart formed an inside bar this week. It is in a tight 2-month bull channel within a 6-month bull trend.
The weekly S&P 500 Emini futures candlestick chart had a small bear doji inside bar this week. Because the bull trend is strong, this week is a buy signal bar for next week. But, the past 5 weeks have been mostly sideways and this week has a bear body. Therefore, this is not a strong buy setup.
The bulls have measured move targets above at around 3,100 and 3,200. They should be able to reach at least the lower target within the next few months, even if there is a sharp, brief selloff first.
The bears hope that last week formed a micro double top with the high of 4 weeks ago. Since this week did not close near its low, it is a weak sell signal bar. The bears want to trigger the sell next week by trading below this week’s low, but they will need 1 or 2 big bear bars if they are going to get a deep pullback.
The 2-month bull channel is tight and this week is a weak sell signal bar. Moreover, every selloff this year ended within 3 weeks. Consequently, the odds are that any reversal down will end within 2 – 3 weeks.
What if there is a huge October selloff, as sometimes happens? Because the 6-month bull trend is strong, even a fast reversal down to the 20-week EMA will probably be minor. The odds are that it would be brief and the bulls would buy it. There is currently only a 30% chance of a reversal down to the February low without at least a small double top.
Daily S&P 500 Emini futures candlestick chart:
Emini September high might be minor exhaustive buy climax
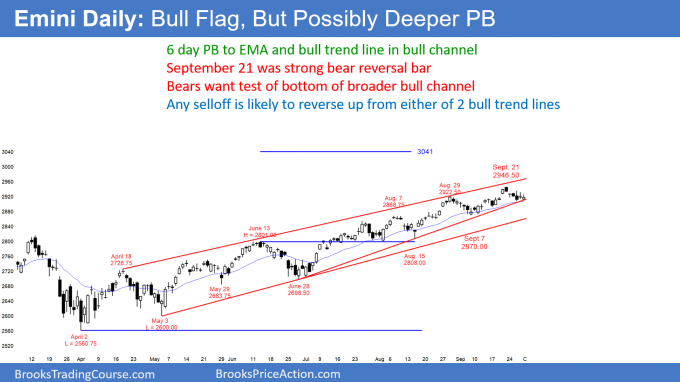
The daily S&P 500 Emini futures candlestick chart had a strong sell signal bar recently late in a bull channel. The pullback might continue down to the August low.
Friday was the last day of the week, month, and quarter. The daily S&P 500 Emini futures candlestick chart has been in a bull channel for 6 months. Since the July low, the channel has been tight. While that is a sign of strong bulls, it is also exhaustive. Therefore, there is a growing risk of a trading range.
The bulls are hoping that the 6-day pullback is a bull flag. But, there have been many bear bars, and any rally might form a double top with the September high. If instead there is a new high, it would be the 3rd leg up from the August 15 low. A reversal down would create a wedge top.
Furthermore, the September rally lacked consecutive big bull bars. It therefore looked more like a bull leg in a trading range than a resumption of the bull trend. This increases the chance that the 6-day selloff is the start of a bear leg in the trading range.
Traders are deciding if the September high will be the top for the next several weeks. If so, the downside targets are the support levels below. These include the bull trend line at around 2870, the September low (also around 2870), and the August low at around 2800. In addition, there is the 20-week EMA, which is just below 2840.
How far down can a correction go?
Traders always should think about low probability events because they are usually more likely than what seems reasonable. Currently, there is a 50% chance that the September top will be the start of a move down to the 20-week EMA. There is a 40% chance of a selloff down to the June low of 2700 and a 30% chance of a reversal to below the February low.
While the odds favor higher prices after 2 – 3 weeks down, if the bears begin to create consecutive big bear bars, traders will begin to consider the possibility of a deeper pullback.
Trading Room
Traders can see the end of the day bar-by-bar price action report by signing up for free at BrooksPriceAction.com. I talk about the detailed Emini price action real-time throughout the day in the BrooksPriceAction.com trading room. We offer a 2 day free trial.


