

The monthly S&P 500 Emini futures candlestick chart rally is stalling just above the January high. Every low for the past 6 months is above the low of the prior month. This is now a 7-month bull micro channel, writes Dr. Al Brooks Saturday.
Since that is getting extreme, the odds of a pullback are increasing. Therefore, October is likely to trade below the September low, or November will pull back below October.
Monthly S&P 500 Emini futures candlestick chart:
Bear bar in 7-month bull micro channel
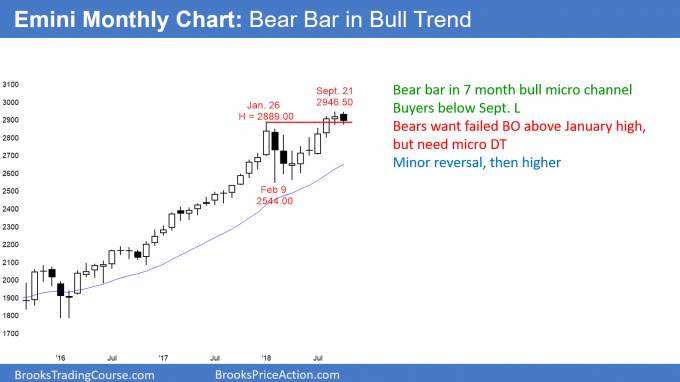
The monthly S&P 500 Emini futures candlestick chart has not had a pullback in 7 months. September was a doji bar, which is a sign of a loss of momentum. This month so far is a bear bar.
The monthly S&P 500 Emini futures candlestick chart rally is stalling just above the January high. Every low for the past 6 months is above the low of the prior month. This is now a 7-month bull micro channel. Since that is getting extreme, the odds of a pullback are increasing. Therefore, October is likely to trade below the September low, or November will pull back below October.
A micro channel is a climax, but it is also a sign of strong bulls. Consequently, the bulls will probably buy the 1st pullback. Traders should expect buyers below the September low.
Can the pullback instead be a higher high major trend reversal, compared to the January high? There is only a 30% chance of a bear trend without at least a micro double top. Therefore, as strong as the selling was this week, the downside will probably be limited to a month or two.
Weekly S&P 500 Emini futures candlestick chart:
Emini outside down week likely start of October pullback to 2800
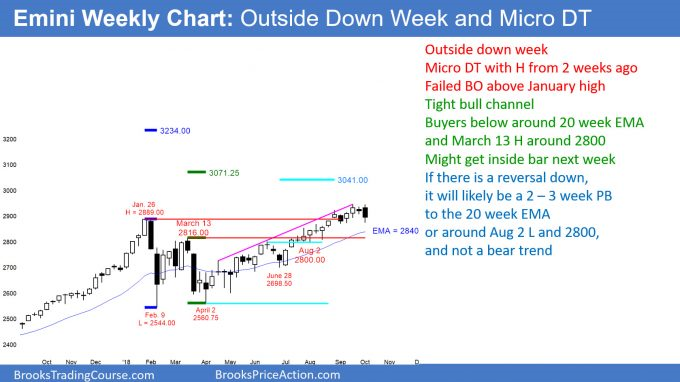
The weekly S&P 500 Emini futures candlestick chart reversed down from above the high a week ago and traded below the low. This week therefore is an outside down week.
The weekly S&P 500 Emini futures candlestick chart was overbought and it is beginning to form bear bars. Last week (ending Oct. 5) was an outside down bar and it closed below the previous week’s low. It is probably the start of a pullback to the 20-week EMA. Even if the Emini tests back to the middle of the 2018 range, the odds still favor a rally to the measured move targets at around 3,100 and 3,200 before a break below the February low.
The bears need follow-through selling the week of Oct. 8. If this week is a big bear bar closing near its low and below last week’s low, the selloff might retrace 50% of the 6-month rally. That is unlikely.
If instead this week (Oct. 8) is a big bull trend bar, it will erase this week’s bearishness. This is also unlikely. If it were to happen, traders would conclude that last week was simply a brief test of the January high and the September low, and the bull trend was intact.
Every pullback in 2018 ended by the third week. Traders should expect this one to be brief as well. However, the weekly EMA is about 100 points below the September high. In addition, the pullback could test the March 13 high and the August 2 low at around 2800. Consequently, a 100 – 150 point pullback in 2 – 3 weeks means that the selloff might be fast.
Outside bar increases chance of inside bar
Whenever there is an outside bar, there is an increased chance of an inside bar for the next week. If the week of Oct. 8 is a bull inside bar, there would be an inside-outside-inside (ioi) pattern on the weekly chart. This is a Breakout Mode pattern. A bear inside bar is a good sell signal bar, while a bull inside bar would increase the odds of higher prices next week.
However, the selling was strong enough last week to make a pullback to the 20-week EMA likely, and a pullback to 2800 reasonable. This is true even if next week is an inside bar or mostly overlaps this week, or if the Emini stays sideways for a few weeks.
Daily S&P 500 Emini futures candlestick chart:
Break below 5-month bull trend line
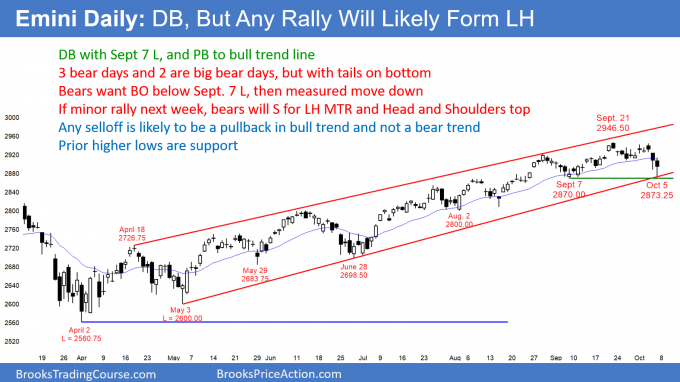
The daily S&P 500 Emini futures candlestick chart sold off for 3 days to test the bull trendline from the May 3 and June 28 lows. It also broke below the previous week’s low, which is the neck line of a 3-week double top. However, the big tails at the bottom of the 2 big bear days increase the chance of a bounce from a double bottom with the September 7 low.
Over the past 3 weeks, I have been writing that the September rally lacked consecutive strong bull bars, and it was therefore probably a bull leg in a trading range and not a resumption of the bull trend. Furthermore, I said that a trading range has legs up and down, and therefore traders should expect a selloff to test the September 7 low at the bottom of the range. Last week ending Oct. 5 achieved that objective.
So, what happens next? The bulls see the big tails on the bottom of Thursday’s and Friday’s bars. They hope that the Emini will form a double bottom bull flag with the September 7 low. While those tails represent buying, the selloff was strong enough for traders to expect a break below the September low.
This is true even if the Emini rallies the week of Oct. 8 from the September 7 low. The odds favor either a breakout below early next week or a rally to a lower high, and then a bear breakout.
Head and shoulders top major trend reversal unlikely
If the Emini rallies to a lower high, it would be a lower high major trend reversal and the right shoulder of a head and shoulders top. But, even a perfect top only has a 40% chance of leading to a bear trend. As a result, whatever selloff that comes over the next few weeks will still probably only be a deep pullback in a bull trend.
If the bears get consecutive closes below the September 7 low, traders will look for a measured move down based on the height of the September trading range. That would be around 2800, the August 2 low, and the March 13 high. Since it is a confluence of support, it is a reasonable target for the pullback.
I haven’t seen any TV pundit talk above a break below the February low. That is because it is currently a low probability bet. However, traders should constantly be aware of the opposite of what they think is likely. It is always more likely that you think.
Yes, the odds favor a new all-time high, even if this selloff falls to 2800. However, there is still a 30% chance of a break below the February low before the Emini reaches the measured move targets on the weekly chart. If there is a strong selloff over the next few weeks, that probability will increase to 40%, and even 50% if the Emini quickly falls to 2700.
Trading Room
Traders can see the end of the day bar-by-bar price action report by signing up for free at BrooksPriceAction.com. I talk about the detailed Emini price action real-time throughout the day in the BrooksPriceAction.com trading room. We offer a 2 day free trial.


