

In part 1 of our commentary, we discussed the current Fundamental Gravity of our “Reflation’s Rollover” macro theme. If you missed part 1, I would encourage you to read through that first, before jumping into part 2 here, writes Landon Whaley Friday.
We covered a great deal of critical fundamental developments, which are bearishly impacting crude oil-related equities and the US-listed ETF, SPDR S&P Oil & Gas Exploration & Production ETF (XOP).
Quantitative Gravity says what?
As a quick reminder, the Quantitative Gravity component of our Gravitational Framework is not technical analysis, which is ineffective and misleading. Rather, we use quantitative measures based on the reality that financial markets are a nonlinear, chaotic system.
We’ve identified four primary quantitative dimensions of financial markets that affect price movement: energy (trend), force (momentum), rate of force (buying pressure), and a market’s irregularity (level of imminent drawdown risk).
SOCIAL is our measure of a market’s current energy (or trend). XOP’s Social reading indicates it is currently asleep, but the most likely trend condition for XOP when it awakes is a bearish hangover.
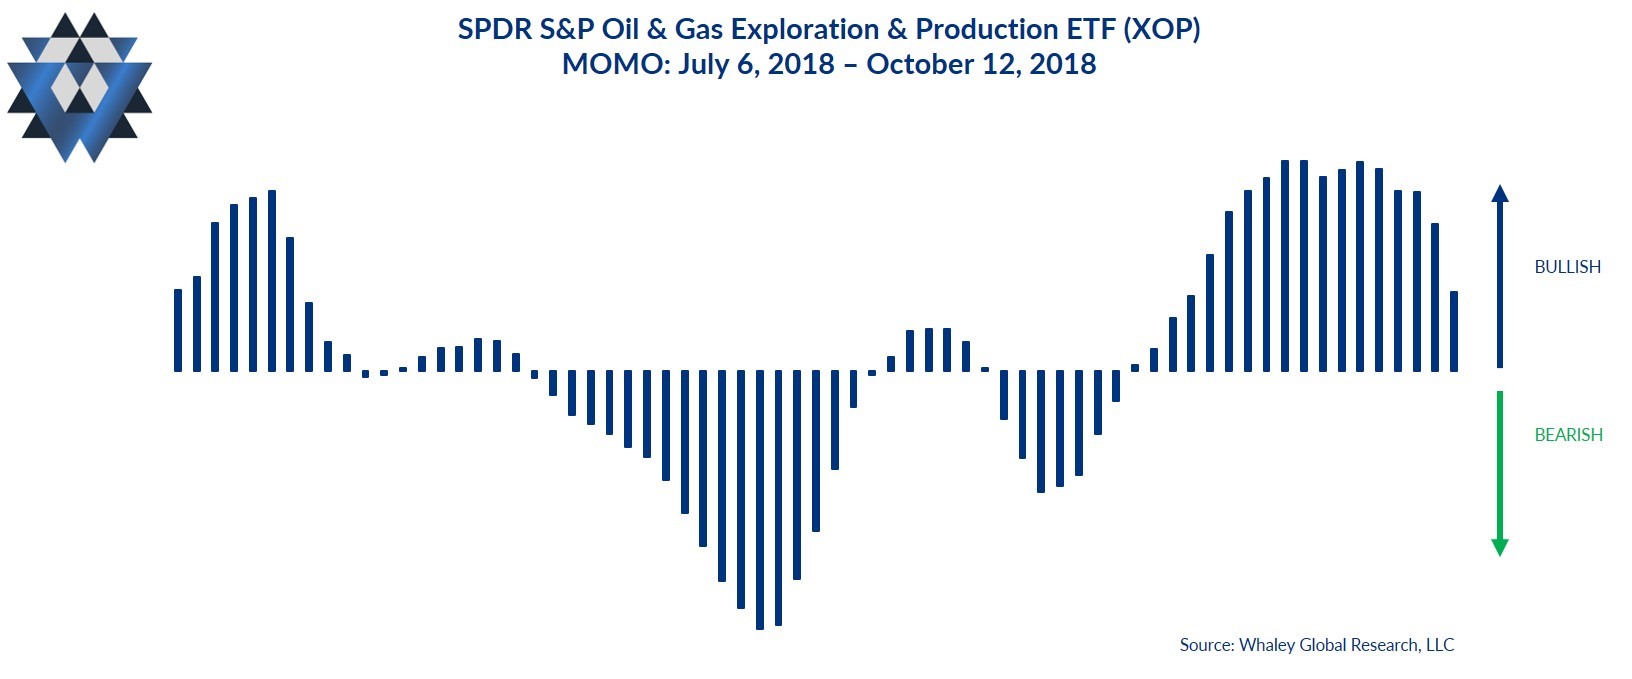
MOMO is our measure of the amount of force behind the market’s current state. XOP’s Momo peaked in bullish territory on September 28 and has been getting less bullish ever since. Its current reading is neutral, but the slope of this quantitative factor is clear: it’s headed to bearish territory posthaste.
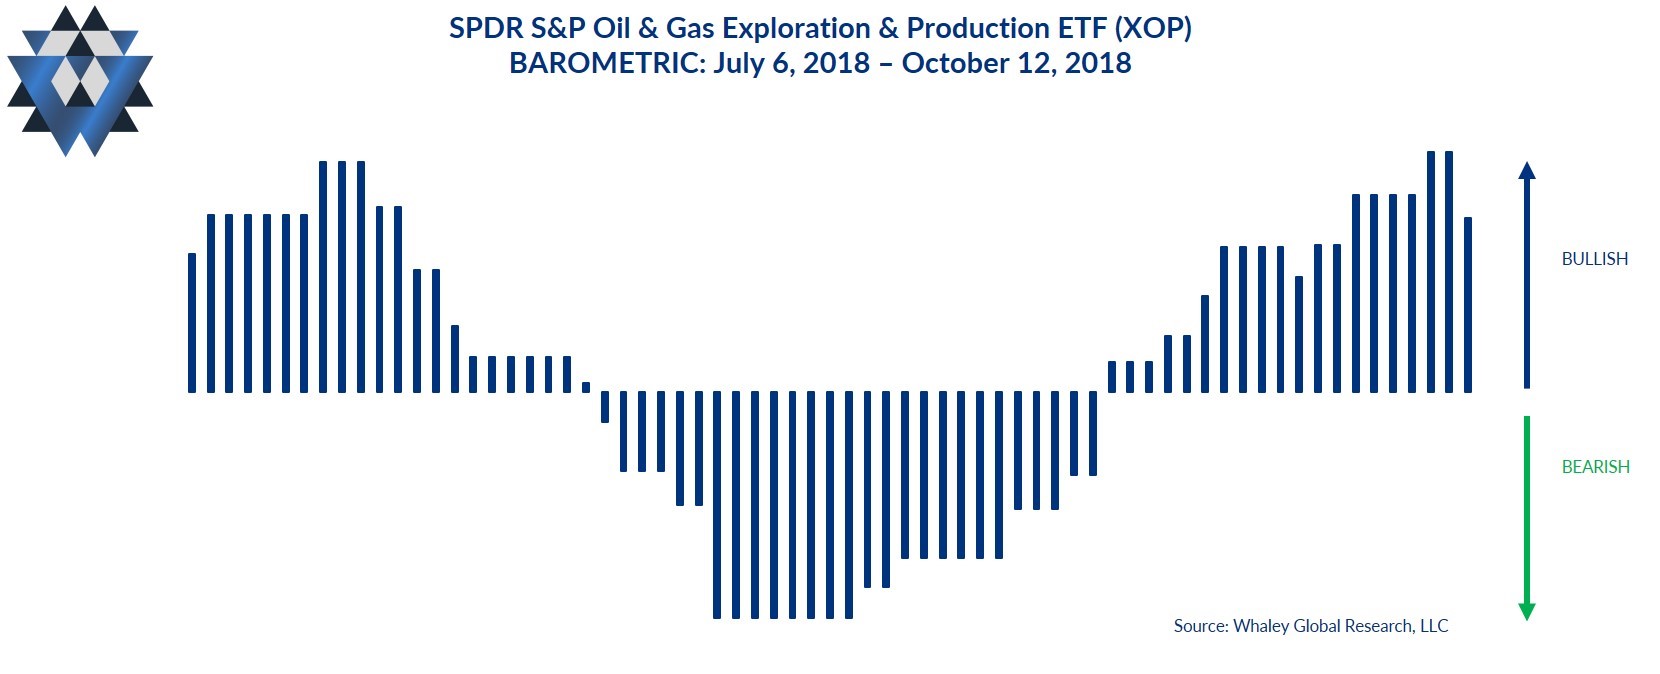
BAROMETRIC is our measure of buying and selling pressure or the rate of force behind the current Momo. XOP’s Barometric indicates that buyers are still in control of this market, but that their strength is starting to wane.
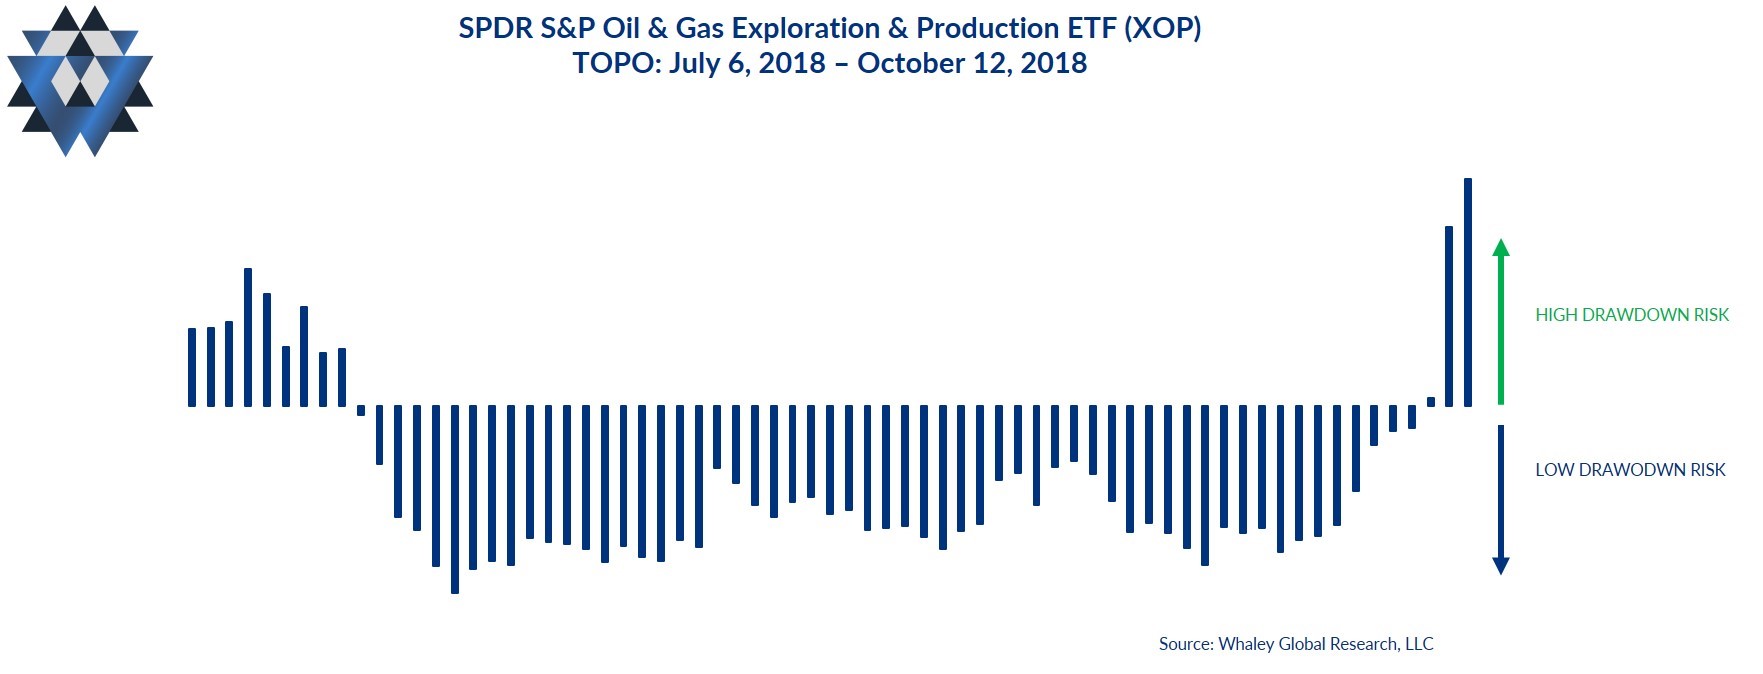
TOPO, which measures the probability of a drawdown, is indicating an extremely high level of drawdown risk for XOP over the next 10 trading days. Until last week, XOP’s Topo reading had been in bullish (extremely low risk) territory for 58 straight trading days. This is a critically important bearish development.
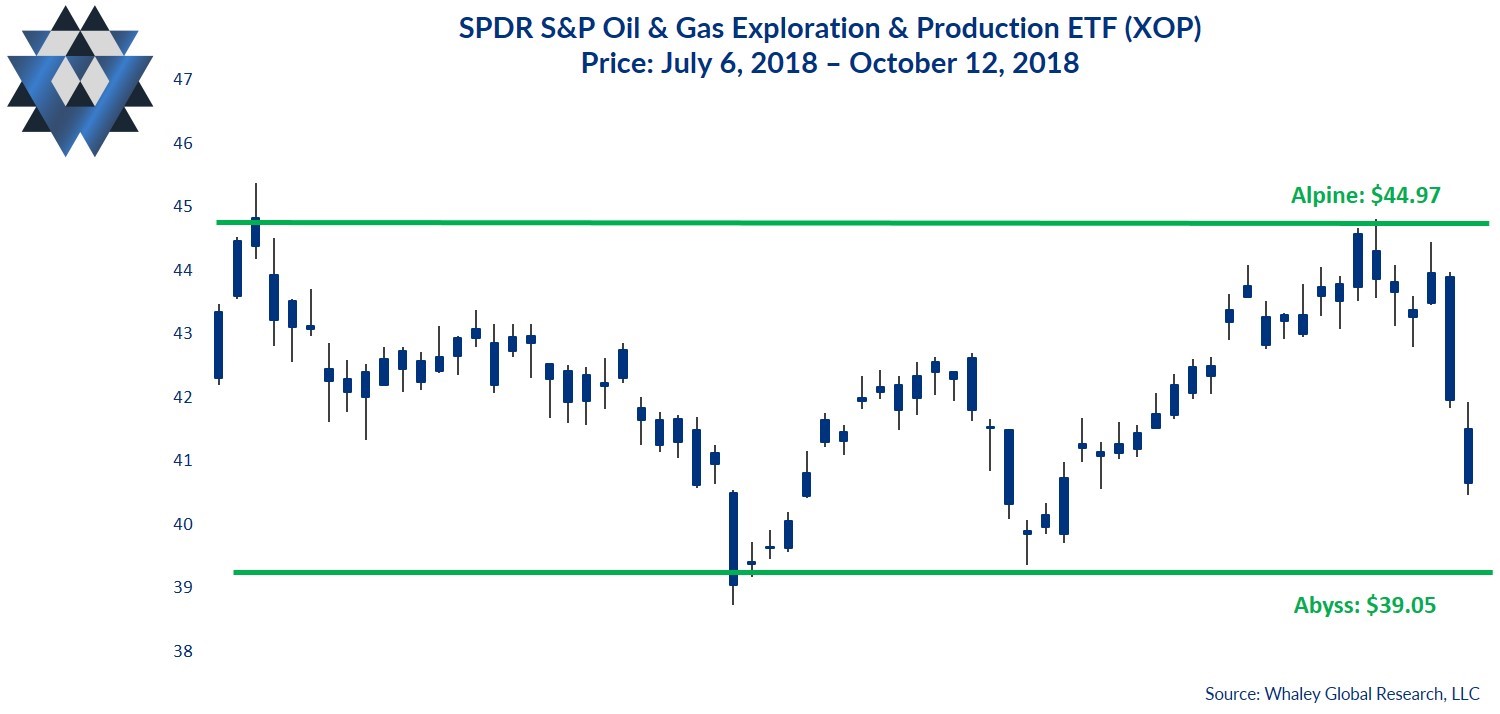
Alpine and Abyss Lines
Our proprietary ALPINE and ABYSS lines are not “support” and “resistance.” Rather, they are the areas (calculated using fractal geometry and Chaos theory) above and below the most recent closing price where price is likely to experience an acceleration in its current trajectory, or a possible reversal of its current course. When a particular market’s price interacts with the ALPINE or ABYSS areas, regardless of whether the price is rejected by the ALPINE or ABYSS area or is able to breakout above (or breakdown below) it, the outcome gives you critical insight into the most likely direction of that market.
The most critical Alpine area for XOP above Friday’s closing price is between $43.97 and $44.97. This means that it’s highly likely that any upside price momentum will stall at this area. However, if XOP closes decisively above that area, price is likely to accelerate higher from there.
The most critical Abyss area for XOP below Friday’s closing price is between $39.71 and $39.05. This means that it’s highly likely that any downside price momentum will stall at this area. However, if XOP closes decisively below that area, price is likely to accelerate lower from there.
The Quantitative Gravity bottom line is that it doesn’t get much better for shorting than when a market starts to turn less bullish and all Quantitative Gravity factors are skewing to the bearish side.
Behavioral Gravity says what?
Behavioral Gravity allows us to evaluate investors’ perception of this market and how that perception changes and shifts over time.
The Behavioral Gravity Index (BGI) for XOP has been riding in neutral territory for several months now. Nevertheless, investors have plowed an additional $338MM into XOP since it peaked on July 10 despite the ensuing -8.8% decline.
The behavioral bottom line is that being short U.S. crude oil-related equities remains a contrarian idea because investors aren’t picking up on the downtrend in inflation. There is a very low behavioral risk to initiating (or holding) short positions in XOP.
The Trade Idea
As long as XOP trades below $44.97, new short trade ideas can be initiated opportunistically on rallies. Depending on your entry and how much room you want to give this trade idea to move, use a risk price between $43.17 and $44.97. That said, your risk price line in the sand is $44.97. If XOP closes above that price, exit any open trades. If the trade moves in your favor and XOP trades down to the $39.05 area, consider closing some, or all, of your position.
We are currently out of XOP in our Asset Allocation Model and will send out an alert if we get the right entry price that skews the reward-to-risk characteristics of the short trade in our favor.
In addition to providing detailed analysis and trade ideas like this commentary on a weekly basis, we also provide real-time email alerts whenever we add, or close, a position in our Asset Allocation model inside our Gravitational Edge report.
Please click here and sign up if you’d like to receive an email alert when we initiate or close our position in this market and to participate in a four-week free trial of our research offering, which consists of three weekly reports: Gravitational Edge, The 358, and The Weekender.
Watch Landon Whaley’s 3 Ideas for Investing in a short video here.
Recorded: MoneyShow Dallas Oct. 5, 2018.
Duration: 6:42.
Watch Landon Whaley discuss When Markets Cycle in a short video here.
Landon Whaley: We have a generation of investors and asset managers who know only one market. The reality is markets and economies cycle and catch people off guard.
Recorded: MoneyShow Dallas Oct. 5, 2018.
Duration: 5:51.
Landon Whaley interviews trader Jackie Ann Patterson: How I got started trading and how I approach it with my Truth about ETF Rotation here..
Recorded: MoneyShow Dallas Oct. 5, 2018.
Duration: 6:14.


