

The jobless claims report showed claims fell from 215,000 to 210,000 which is close to the cycle low. The 4-week moving average increased from 209,750 to 211,750. The big story from this report is there wasn’t an effect from Hurricane Michael, writes Don Kaufman.
Claims in Florida fell 600 to 6,400. Based on the disaster the hurricane caused, I expect claims to increase in the next report. There was a delayed bump in claims after Hurricane Florence. That was a temporary effect which has subsided as the claims in the Carolinas fell sharply this week.
Continuing claims fell 13,000 to 1.640 million; the 4-week moving average fell 1,250 to 1.653 million. Both are at a 45- year low. The unemployment rate for insured workers fell to 1.2%. The survey for the monthly BLS jobs report occurs in the third week of the month which is next week’s jobless claims report.
That could be interesting if there’s a spike due to Hurricane Michael. It was a devastating storm which killed 50 people and caused over $8.1 billion in damage thus far. Hurricane Florence killed 53 people and caused over $13 billion in damage.
Strong Philly Fed report
As you can see from the chart below, the general business activity index fell from 22.9 to 22.2 in October. This is another solid report with strong new order growth like the Empire Fed report. The new orders index increased from 19.3 to 21.4. Also, just like the Empire Fed report, the unfilled orders index fell, and the shipments index increased as the supply chain struggles were solved. The unfilled orders index fell from 12.6 to -2.6 and the shipments index increased from 19.6 to 24.5.
Furthermore, the delivery times index fell from 11.1 to 0.2. In the past few reports, the price indexes have fallen. You would think the supply chain improving would cause them to fall further, but they were mixed. Prices paid fell from 39.6 to 38.2. Prices received increased from 19.6 to 24.1.
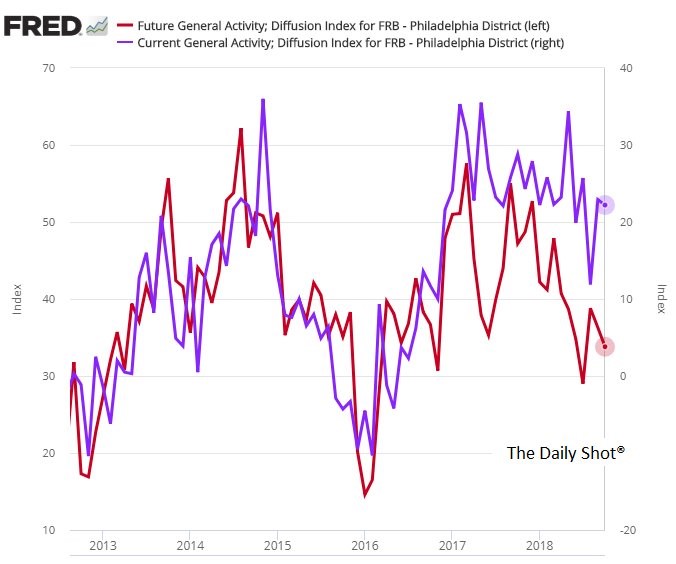
The chart shows the 6-month future expectations fell slightly from 36.3 to 33.8. Keep in mind, the future index uses the left scale. The scaling makes it look like they have recently diverged, but they are often far apart. Sometimes they move in the same direction and sometimes they don’t.
Early in the recession, the future index improved while the current index fell. It didn’t work as a leading index for the current report then and might not work that way now. The future new orders index improved from 34.7 to 43.3. The capital expenditures index fell from 26.7 to 25.2.
Existing Home Sales
There were many housing reports last week. The most important one is existing home sales. Seasonally adjusted existing home sales fell from 5.33 million to 5.15 million in September. This missed estimates for 5.3 million.
Month over month home sales were down 3.4% which is on top of last month’s decline of 0.2%. You can tell by that two-month decline that year over year sales were also down. They fell 4.1% after falling 1.7% in August. The last time existing home sales fell 4% was in 2007.
Robert Toll, the co-founder of Toll Brothers stepping down as chairman is a bad sign. Toll Brothers (TOL) stock is down 35.22% year to date. It’s down 40.43% since its high in January. From July 15, 2005 to February 24, 2006 the stock fell 40.43%.
That’s not a guarantee another housing decline is about to occur, but the homebuilder stocks are also signaling the market is about to falter. The homebuilders index is at a 21-month low, is down 21 out of the past 23 trading days, and is down 29% from its January high.
The table below breaks down sales in each price range and region. The sales for houses under $100,000 are down 18.3% and are now only 8.6% of the housing market. As housing prices increase, there won’t be many houses below $100,000 besides tiny homes.
The important point to realize is overall sales fell in every price category. When sales decline, it becomes a buyers’ market which leads to falling prices. Year over year price growth in Raleigh peaked at 9.25% in Q2 2017; in Q2 2018 growth fell to 6.23%.
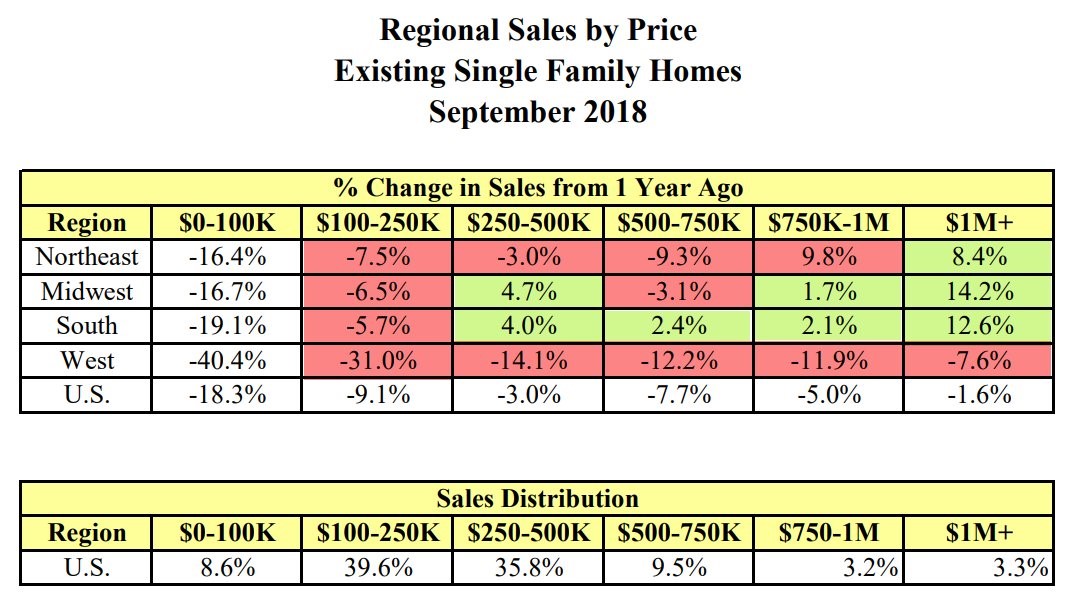
Hurricane Florence hurt sales in the South as they fell 5.4% month over month. However, they were also weak in the Northeast and West as they fell 2.9% and 3.6%. The Midwest was the best region month over month as it was flat. On a year over year basis, the Northeast was down 5.6%, the Midwest was down 1.5%, the south was down 0.5%, and the West was down 12.2%.
Median existing home prices were down 2.8% month over month to $258,100 and up 4.2% year over year. The decline in sales suggests that price growth will fall.
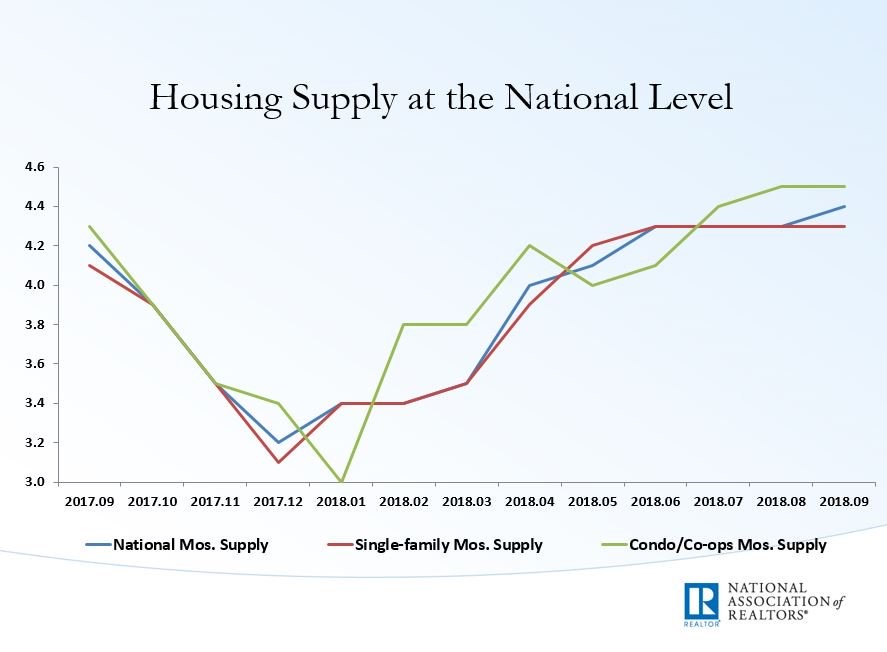
The number of resales on the market fell 1.6% to 1.88 million. Since sales fell sharply, supply on the market improved from 4.3 months to 4.4 months.
As you can see from the chart below, the national supplies troughed at 3.2 months in late 2017. I don’t think the weakness this year is being caused by supply limitations. The inability to build multi-family houses in the city because of regulations has boosted housing prices in cities. The 30-year interest rate on home loans has increased to 5% which has spurred consumers to claim housing is the most unaffordable since the peak in 2007.
Conclusion
The Philly Fed index shows the manufacturing sector likely continued its strong growth in October. It’s backed by a solid September industrial production report.
The housing market is showing signs of topping. The weakness in existing sales and the collapse in housing stocks shows year over year price growth can’t continue at 4.2% for much longer.
There won’t be a housing bust like last cycle, but housing prices can fall especially if interest rates continue to rise. The Fed is hiking rates until they break something. The housing market could be the first thing to break.
Subscribe to TheoTrade here...
View a brief video interview with Don Kaufman on volatility for traders and investors here
Recorded at TradersExpo New York Feb. 25, 2018
Duration: 2:34.


