

Because the bear bar so far is surprisingly big and it followed a strong 6-month rally, traders are confused. Big Up, Big Down, creates Big Confusion, writes Dr. Al Brooks Saturday.
The only thing that traders believe is likely is that the next couple of months will not go far up or down. Traders will take quick profits and bet on reversals. This will probably result in at least a few more sideways months.
Monthly S&P 500 Emini futures candlestick chart:
Big bear bar, but trading range more likely than bear trend
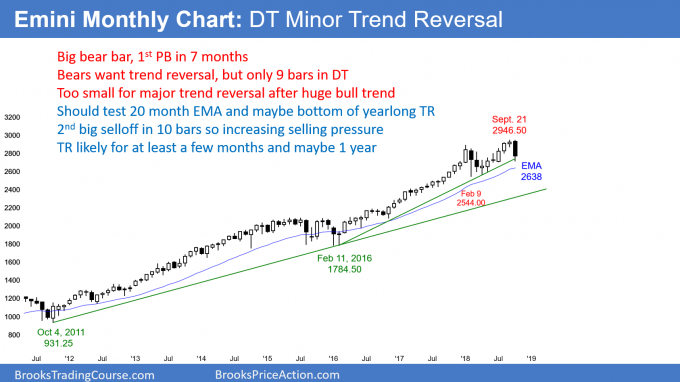
The monthly S&P 500 Emini futures candlestick chart has a big bear bar so far for October. However, it followed a 6-bar bull micro channel. Furthermore, the double top with the January high only has 9 bars. That is probably too small to reverse the 2-year tight bull channel.
Since the double top is small compared to the strong 2-year bull trend, this month’s selloff is probably a minor reversal. Therefore, a trading range or bull flag is more likely than a bear trend. The minimum first target is a test of the 20-month EMA at 2638. If the Emini gets there this year, it will also fall below the 2689.75 close of last year.
If instead this month is a bear trap and the market quickly rallies to a new high, the high will probably be brief. The strong selling in February and again in October represent a market in transition. Instead of a strong bull trend, the monthly chart is evolving into a trading range. There will probably be sellers above the September high. This would create a small wedge top.
In addition, there will be buyers below the February low. The result of buying low, selling high, and taking quick profits will be a trading range. This could last for a year or more, like the one from late 2014 to early 2016.
Weekly S&P 500 Emini futures candlestick chart:
No follow-through selling after the bear breakout a week ago
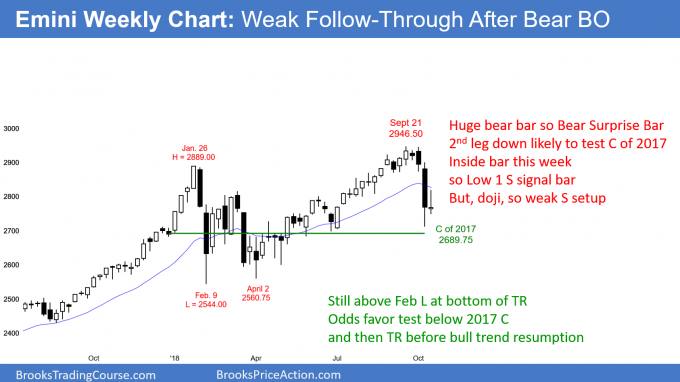
The weekly S&P 500 Emini futures candlestick chart formed a doji inside bar last week after the big bear breakout a week before.
Last week’s doji inside bar represents an absence of follow-through selling after last week’s bear Surprise Bar. Because there was no follow-through selling, traders will conclude that the selloff will probably be a bear leg in a trading range and not the start of a bear trend. However, the bottom of the range might be all the way down at the February low.
This is what traders will discover over the next few weeks. If the bears get more big bear bars, and especially consecutive big bear bars, the odds will favor a test of the February low.
Alternatively, if the Emini reverses up strongly this week (Oct. 22) or from below last year’s close, traders will conclude that the selloff a week before was a bear trap. Traders would conclude that the selling was caused by options selling firms having to hedge in a falling market (see last week’s post). This is in contrast to some fundamental change in the market, which would result in protracted selling over the next several months.
But, the prospect over the next year is unchanged. This is more likely a trading range than the start of a bear trend. Therefore, even if the Emini falls to the February low, it will probably not fall much further. In addition, the odds still favor a move above 3,000, and possibly to the measured move targets around 3100 and 3200, before the weekly chart will enter a bear trend.
Daily S&P 500 Emini futures candlestick chart:
Emini October exhaustive sell climax should test 2017 close of 2689.75
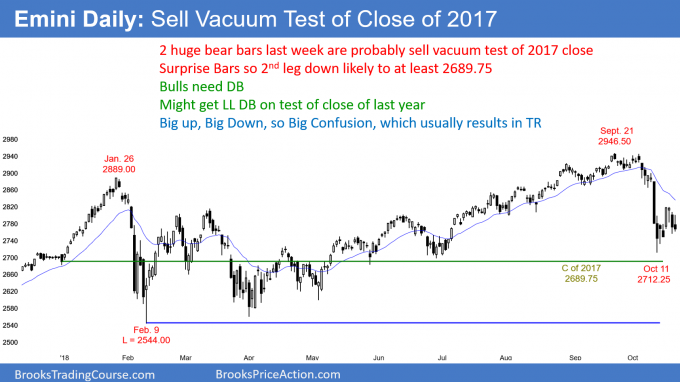
The daily S&P 500 Emini futures candlestick chart has been sideways this week after the huge bear bars a week ago.
The daily S&P 500 Emini futures candlestick chart has entered a trading range after last week’s strong bear breakout. This represents balance and uncertainty. Traders are taking quick profits because they do not believe the Emini is going to go very far near term. The Emini is deciding between a swing down and a reversal back up. Will last week’s bear breakout succeed or fail?
Traders will find out over the next few weeks. If there are consecutive big bull bars or a series of 4 or more unremarkable bull bars, the odds will favor a new high.
Conversely, if there are consecutive big bear bars or a series of ordinary bear bars, the Emini will probably fall below last week’s low and last year’s close. Even if it does, the odds are that there will be buyers below. There is currently only a 40% chance of a test of the February low before a test of the September high.
The importance of last year’s close of 2689.75
Last year’s close is a very important price going into the end of this year. If the Emini finishes the year below last year’s close, traders will say that 2018 was a down year.
Since most years are up, a down year is particularly newsworthy. Clearly, the bulls do not want that to happen. This is especially true after a strong 6-month rally. The year would then be a reversal bar on the yearly chart. If the year were to close near its low, there would be a significantly increased the chance of at least slightly lower prices next year.
Every support and resistance level is a magnet. The Emini is near enough to last year’s close so that it probably cannot escape the gravitational pull of that magnet. Traders should expect a drop below last year’s close within the next few weeks. The bulls will look for a reversal up into the end of the year. That is more likely than a sustained selloff and a close below last year’s close.
In hindsight, traders will probably discover that this strong selloff is simply a test of last year’s close. The market is getting vacuumed down there one final time after oscillating around it for the 1st 6 months of 2018.
Because last year’s close is nearby and the momentum down is good, the Emini will probably fall below last year’s close in the coming weeks.
The big story on the news will be that the selloff erased all of the 2018 gains. Why hasn’t anyone on TV mentioned this yet? They haven’t been doing this for over 30 years. I have learned that elephants don’t always look the same. There is now one in the room and they just don’t realize it yet.
Trading Room
Traders can see the end of the day bar-by-bar price action report by signing up for free at BrooksPriceAction.com. I talk about the detailed Emini price action real-time throughout the day in the BrooksPriceAction.com trading room. We offer a 2-day free trial.


