

Is the volatile start for Q4 in Equities signaling a longer-term transition for the global economy? Perhaps we’ve just seen a preview of the 2019/2020s call for recession by the consensus of economists, asks Ziad Jasani.
Or has this simply been a speed-bump, driven by the rapid rise in rates?

View my weekly strategy session video here.
Recorded: Oct. 19, 2018.
Duration: 2:06:28.
At the Independent Investor Institute our outlook for equities into year’s end has changed from positive to neutral, allowing us to play bounces, but not to use this dip to buy for the longer-term.
This report will help you manage through the week ahead, whether Equities Bounce or get Trounced. As we enter a “must-deliver” heavy-weight week for Q3 earnings (AMZN, GOOG, INTC, MSFT, BA, LMT, CAT, BIIB), market participants are also focused on:
• US Monetary Policy: Hawkish-Fed that “broke” bonds & catalyzed the Oct. 4 Equity sell-off.
• Eurozone (ECB) Monetary Policy: Draghi’s hawkish lean (Oct. 25).
• Italian austerity: Bond crisis won’t go away until their deficit spending is reduced.
• Chinese monetary stimulus Oct. 18: Confirming economic slowdown? But short-term win?
• Saudi strife: Will MBS remain in power?
• U.S. midterm elections: risk of Trump’s power being tapered = slower growth.
• U.S.-China tariff war: Trump reiterates has no intention of easing off.
• Bank Of Canada: Another rate hike? Mistake after CPI and Retail sales data misses?
Does Mr. Market (S&P 500) find a bottom and bounce? Or are we headed lower?
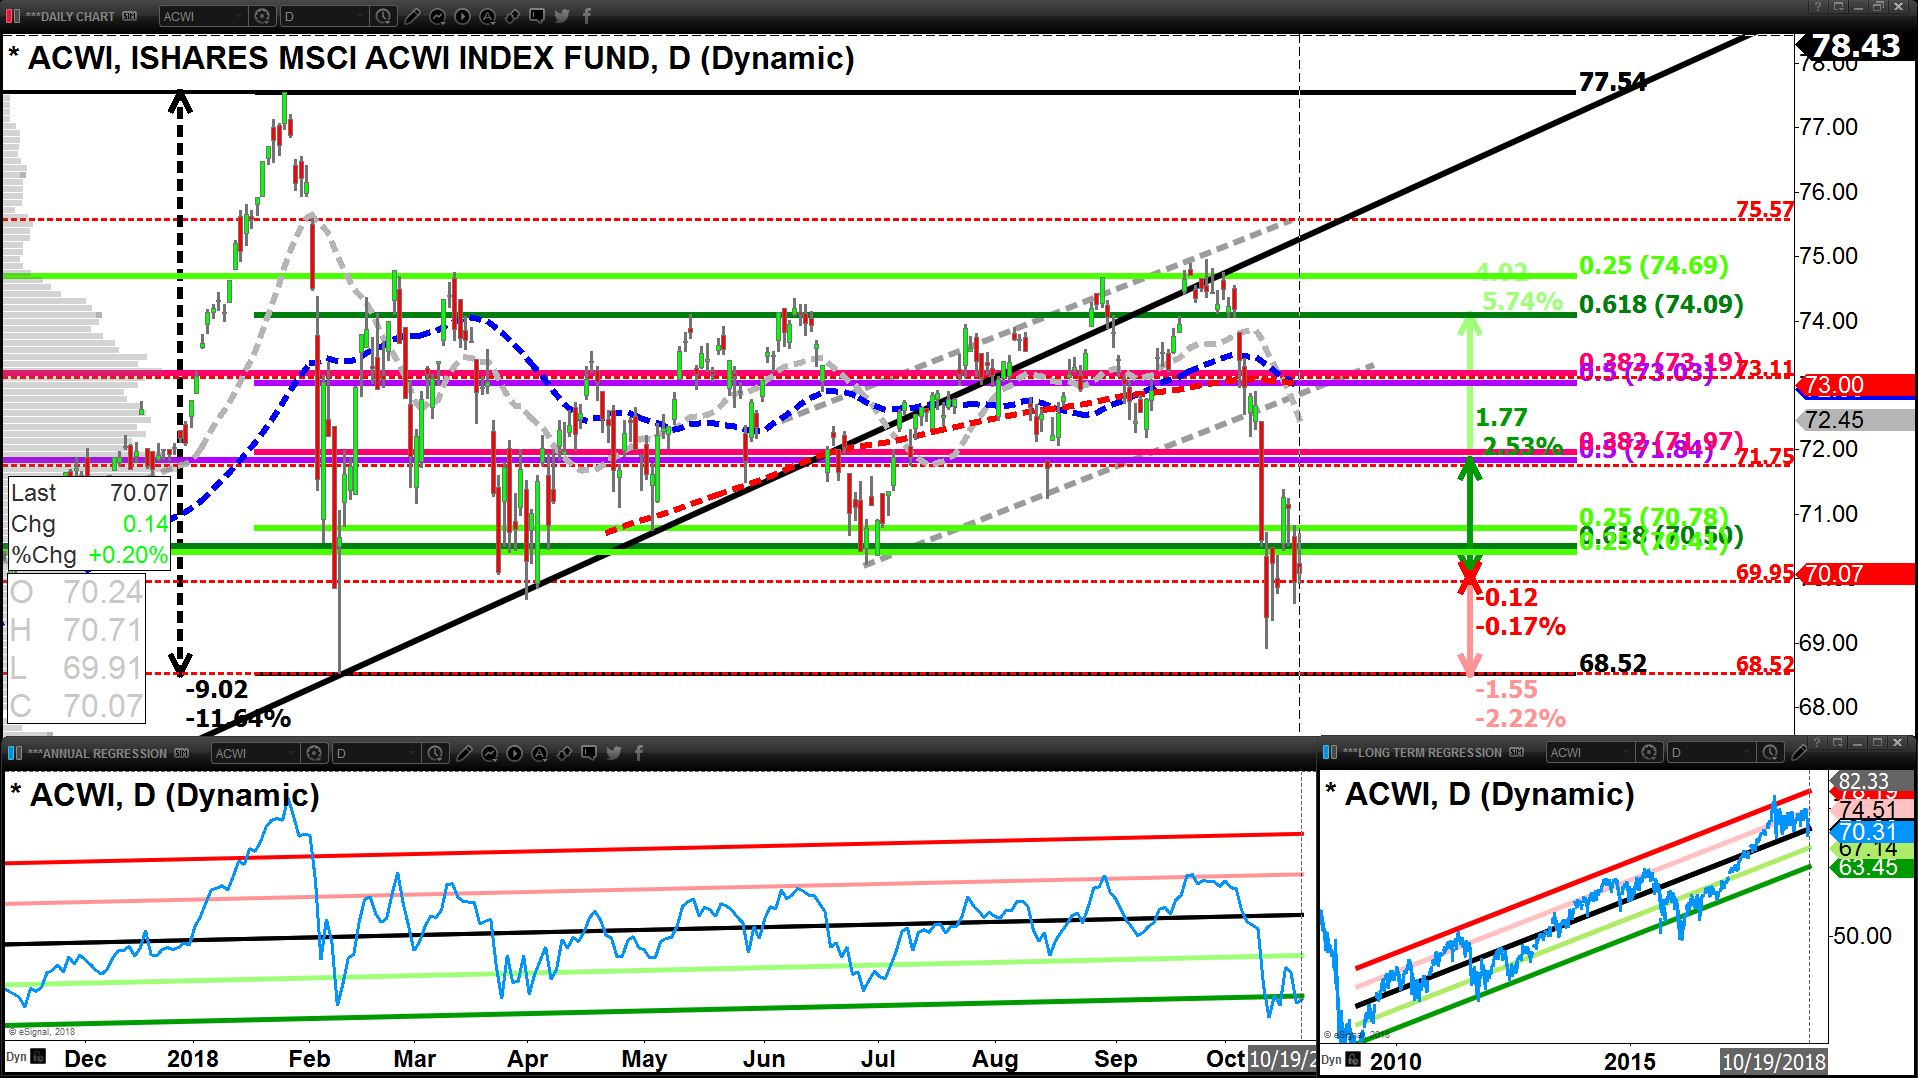
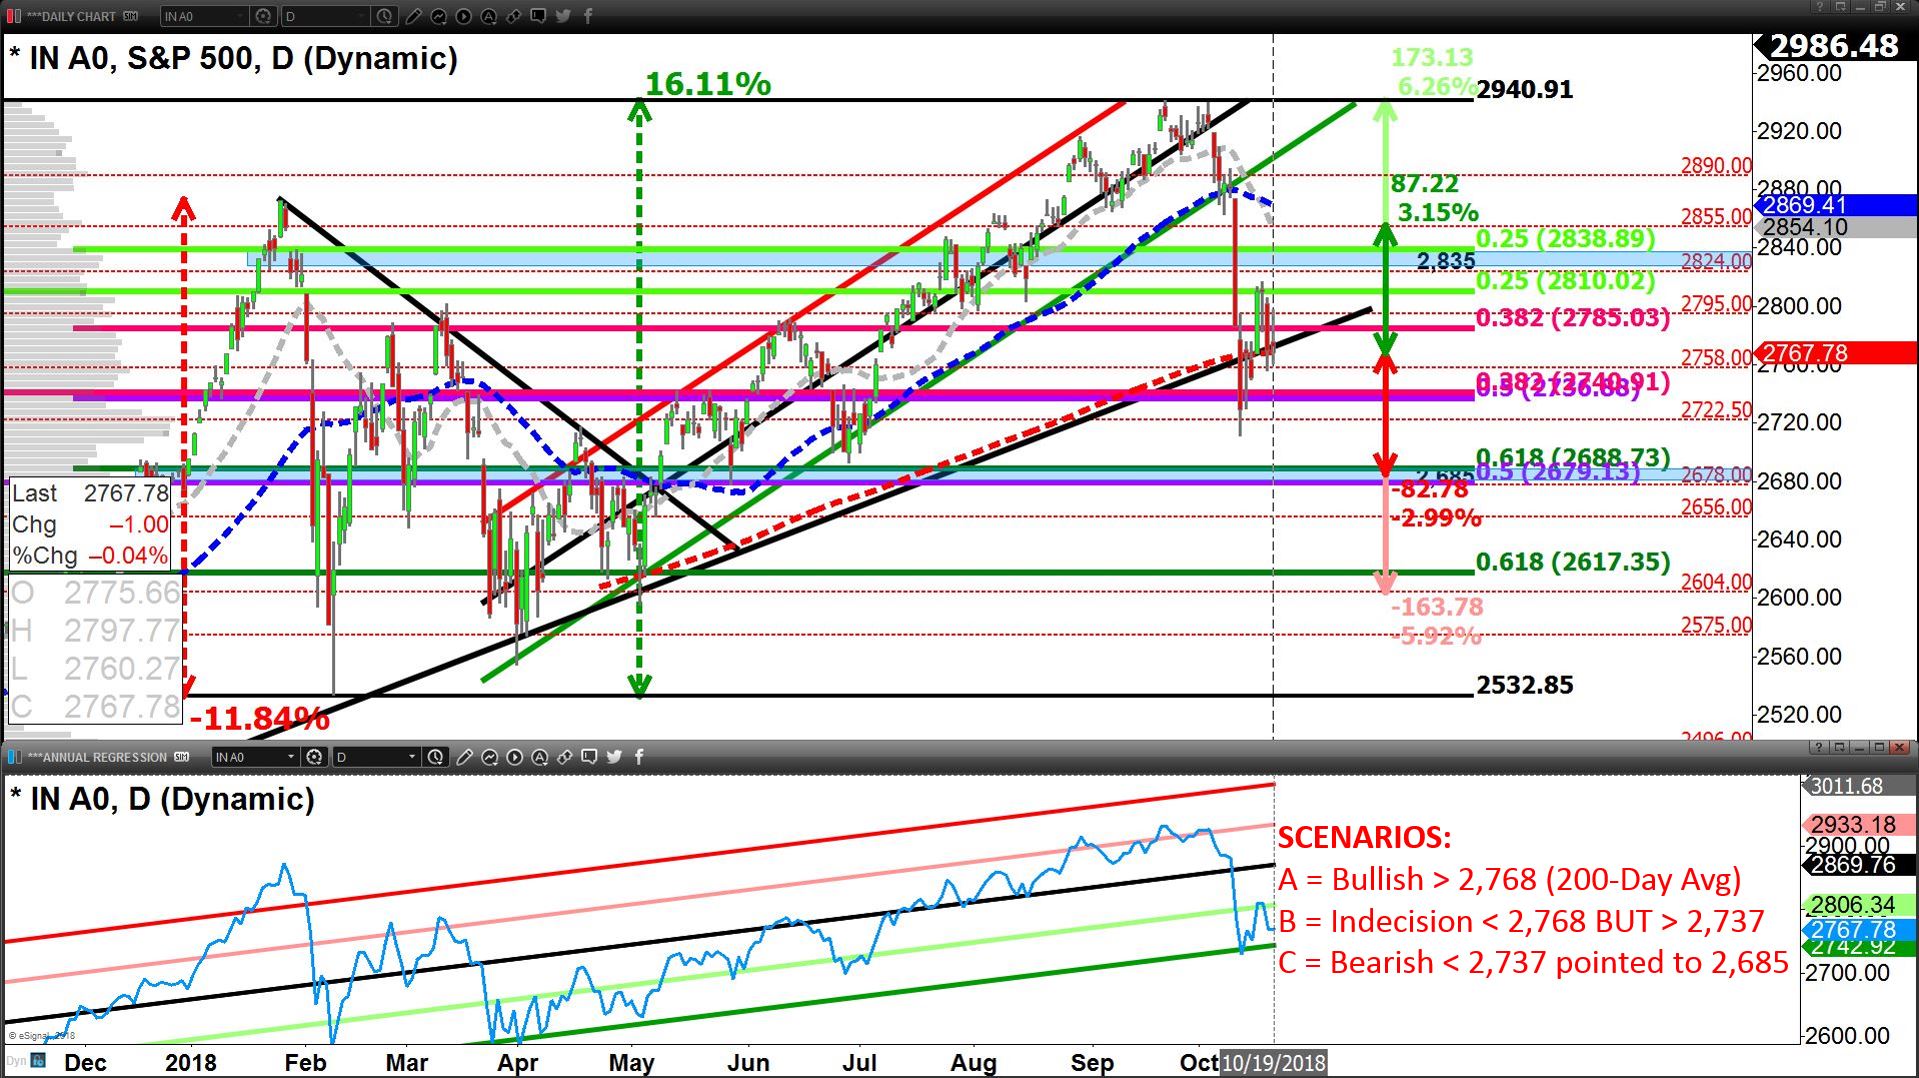
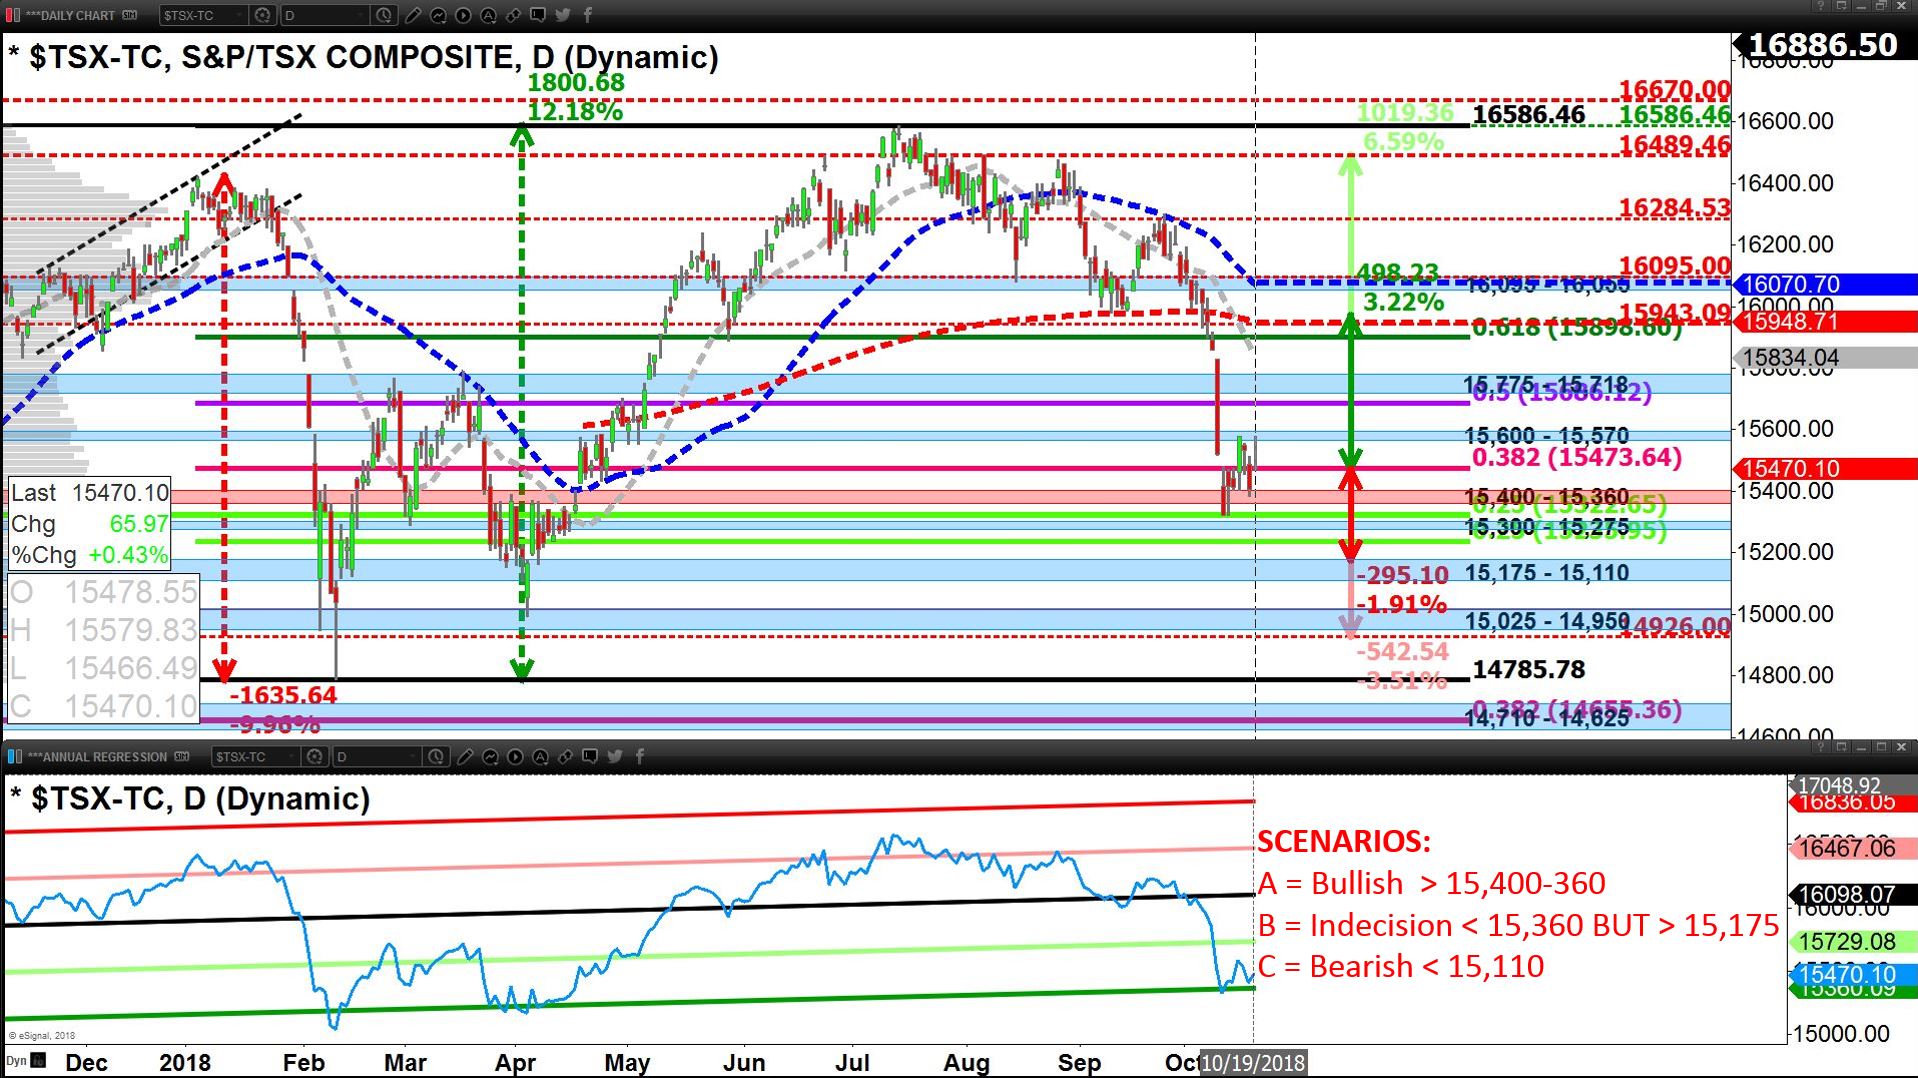
We ended last week (Oct. 19) with the S&P 500 sitting on its 200-day average (2,768) virtually unchanged from the week prior (Oct. 12); the Global Equity Market (ACWI) and TSX behaved similarly.
If our “signaling index,” the S&P 500 remains below its 200-day average to start the week, we note the last short-term (days-to-a-week) safety-net sits at 2,737 (50% retracement line of the year’s range); a break would imply prices fall towards support of 2,685, roughly -3%.
The game-plan for the week is similar to last week:
1. Conduct live analysis of markets in our online Trading Room to determine whether a macro market swing-low formation (bounce) is in place/confirmed; until then we focus on risk management and very short-term trading.
2. Take on bounce trades that are congruent with the behavior of and likely direction of Currencies, Bonds, Commodities, and Currencies as earnings and economic data unfold.
The good news entering this week is volatility in the Global Bond Market is subsiding (for now), which improves the probability for the S&P 500 to hold support of its 200-day average or at least 2,737.
The Global Equity Market (ACWI) presents as dislocated and cheap relative to the Global Bond Market (BND+BNDX), setting up a rise for Stocks and a slower one for Bonds.
The bad news is that Equity volatility remains elevated (VIX), and the U.S. Equity Market remains relatively expensive on annual routines, while the rest of the world presents as cheaper, but has the dark cloud of slowing-growth hovering above it.
This sets up the potential for a break-down that is led by Bonds and North American Equities.
This week the key catalysts for movement in Bond Markets comes on the same days as the catalysts for Equity Markets (Thursday morning ECB press conference, Thursday afternoon’s earnings AMZN, GOOG, INTC, and Friday morning’s U.S. Q3 GDP).
We see a higher probability for Equities to end the week in a bounce, with yields remaining range-bound, Bonds stabilizing, the USD softening and Q3 earnings “open wallets.” However, we will not dig our heels in; if the S&P 500 breaks support of 2,737 we’re turning to the “dark-side” playing short/inverse.
Enjoy a complimentary no strings attached 30-day subscription to Ziad Jasani’s Daily Insights. Simply send Ziad an email with FREE TRIAL in the subject: ziad.jasani@educatedtrader.com


