

We note from a longer-term perspective (10 years+) that the Nasdaq, Dow, Brazil, Russia and Japan are too expensive to consider playing a bounce as a way of building and holding longer-term positions, only short-term bounces, says Ziad Jasani Monday.

View my weekly strategy session video here.
Recorded: Oct. 29, 2018.
Duration: 1:22:31.
View my weekly strategy session video here.
Recorded: Oct. 29, 2018.
Duration: 1:22:31.
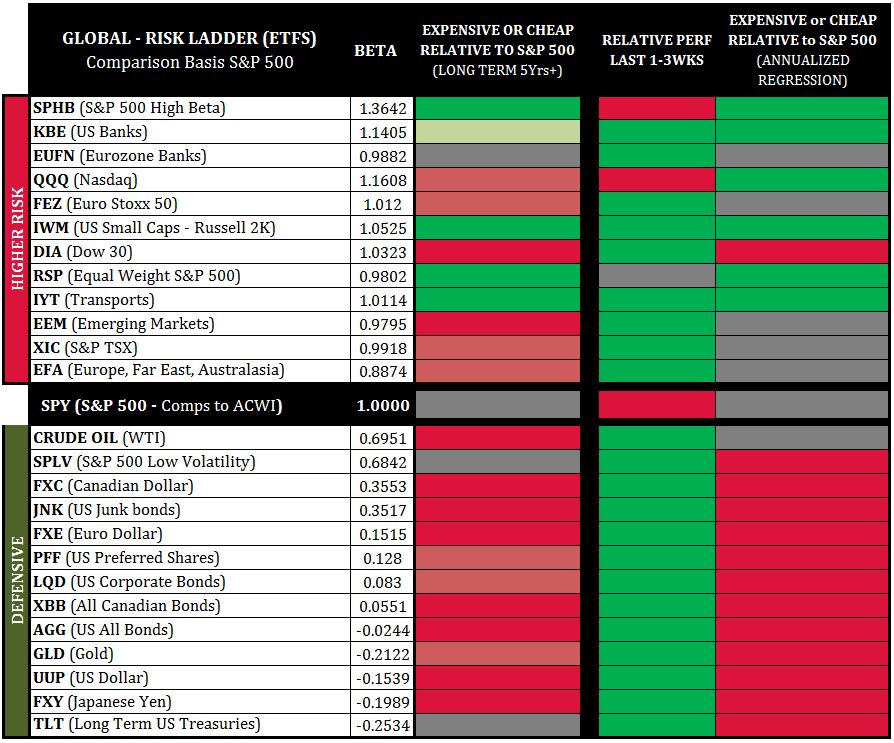
Global Risk Sentiment
Looking at the third column to the right we see a comparison of higher risk asset classes and defensive asset classes back to the S&P 500 (SPY) on an annual basis.
Comparison to the S&P 500 creates a “risk-ladder” where market risk is considered neutral.
When we see more green above the SPY line (middle line) and more red below we have a general “Risk-On” signal; and vice-versa - red above, green below would be “Risk-Off.”
Into the week ahead, we are getting a Risk On signal, as Defensives have gotten polarizingly expensive while higher risk asset classes remain relatively cheap and deeply oversold.
Our market modelling suggests a better chance for a bounce for equities again this week; wherein we will be focused on accumulating: SPHB, QQQ, FEZ, IWM, RSP, EEM, EFA.
However, we note that lift-off for a bounce is not confirmed until the S&P 500 is able to comfortably hold above 2,685. Bottoming is a process, and last Friday’s close did not confirm a bounce to start this week.
Look for the S&P 500 > 2,795-85, ACWI > $68.52, Nasdaq > 7,205, Russell 2000 > 1,494, Dow > 24,759 and TSX > 14,926 to “confirm” markets likely bounce this week.
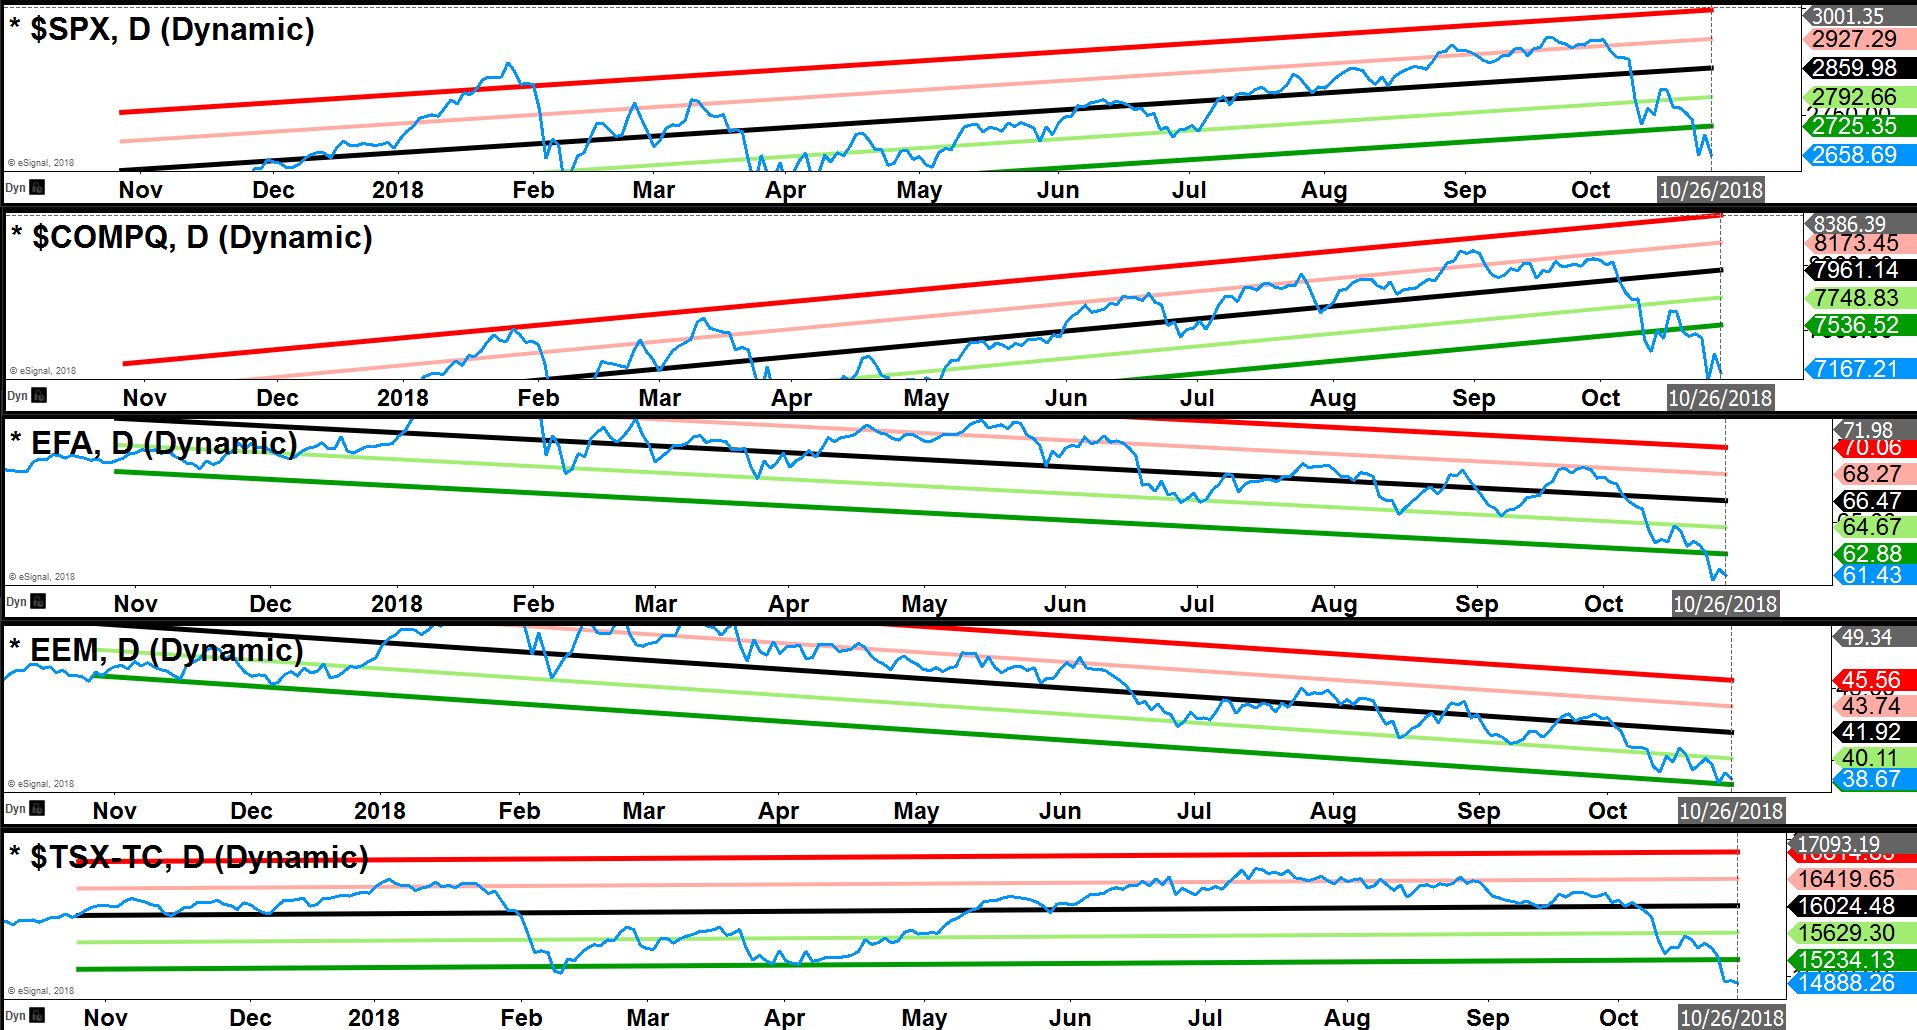
Major Index Direct Price Regression
When humans move very far away from “normal” routines they tend to come back “home.”
In markets, we call this “mean-reversion.” The channels to the right are direct closing prices day over day, enveloped in 2-standard deviation channels (“home” is the middle of the channel).
Last week, all major market indices stayed ~2 standard deviations+ on the cheap side of annual routines. Current presentation of this tool suggests that equities have a higher probability to bounce in the week ahead. We, however, note that the longer direct index regressions remain below the 2 standard deviations marker the more the potential for a “crash” grows. This is “the” week to start “mean reverting or else…
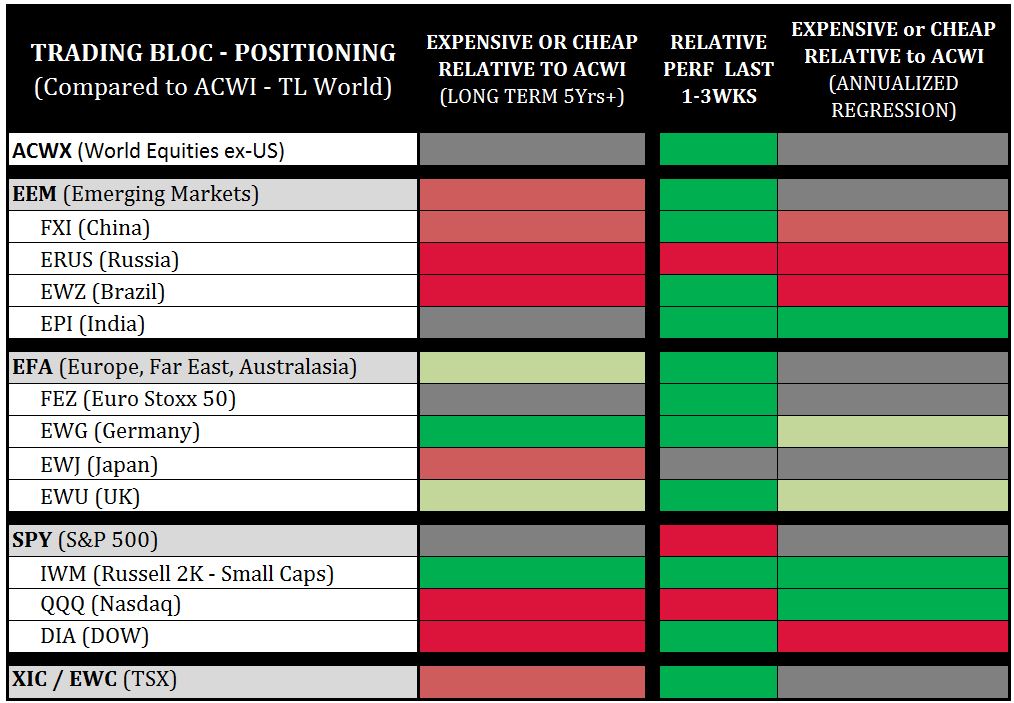
Trading Bloc Positioning
This chart compares major Trading Blocs back to the entire global equity market (ACWI), to determine which spaces are relatively cheaper or relatively expensive.
Why? Capital flows usually tilt towards relatively cheaper spaces, but a catalyst must be present.
If a global-macro market swing-low formation takes hold early in the week, there is a higher probability for a stronger bounce in the following spaces: IWM, QQQ, EWC, XIC-T, EPI, EWU, EFA, FEZ, EWG, EEM.
We note from a longer-term perspective (10 years+) that the Nasdaq, Dow, Brazil, Russia and Japan are too expensive to consider playing a bounce as a way of building and holding longer-term positions, only short-term bounces.
Enjoy a complimentary no strings attached 30-day subscription to Ziad Jasani’s Daily Insights. Simply send Ziad an email with FREE TRIAL in the subject: ziad.jasani@educatedtrader.com


